
- Home >
- Stock Videos >
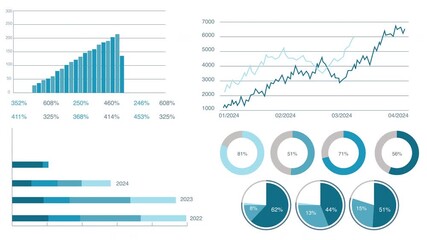
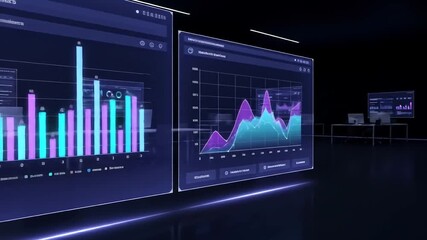
- Futuristic Data Analytics Overlay with Charts and Graphs
Futuristic Data Analytics Overlay with Charts and Graphs Video

This digital art combines multiple data elements like pie charts, bar graphs, and maps, presented in a high-tech style, conveying themes of global business and technology. Ideal for presentations or marketing materials targeting the tech industry or financial sectors, emphasizing analytics, innovation, and cybersecurity.
Powered by 


downloads
Tags:
More
Credit Photo
If you would like to credit the Photo, here are some ways you can do so
Text Link
video Link
<span class="text-link">
<span>
<a target="_blank" href=https://pikwizard.com/video/futuristic-data-analytics-overlay-with-charts-and-graphs/c70e0baed15e29664459d144e60c2777/>PikWizard</a>
</span>
</span>
<span class="image-link">
<span
style="margin: 0 0 20px 0; display: inline-block; vertical-align: middle; width: 100%;"
>
<a
target="_blank"
href="https://pikwizard.com/video/futuristic-data-analytics-overlay-with-charts-and-graphs/c70e0baed15e29664459d144e60c2777/"
style="text-decoration: none; font-size: 10px; margin: 0;"
>
<video controls style="width: 100%; margin: 0;">
<source src="https://player.vimeo.com/progressive_redirect/playback/736623076/rendition/240p/file.mp4?loc=external&oauth2_token_id=1223210874&signature=7f28582530cfe9faecc68a57e8b20437177d0bc71384ac644504cba7cb15a909" type="video/mp4"
poster="https://pikwizard.com/pw/medium/c70e0baed15e29664459d144e60c2777.jpg"/>
Your browser does not support the video tag.
</video>
<p style="font-size: 12px; margin: 0;">PikWizard</p>
</a>
</span>
</span>
Free (free of charge)
Free for personal and commercial use.
Author: Awesome Content