
- Home >
- Stock Videos >
- Futuristic Data Analytics with Bar Graphs and Trends
Futuristic Data Analytics with Bar Graphs and Trends Video
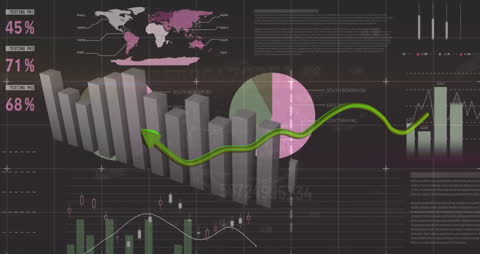
Complex digital visuals featuring bars and trend lines represent data analytics and financial growth, ideal to portray business and economics strategies. Useful for tech presentations, data visualization blogs, or finance websites.
Powered by 


downloads
Tags:
More
Credit Photo
If you would like to credit the Photo, here are some ways you can do so
Text Link
video Link
<span class="text-link">
<span>
<a target="_blank" href=https://pikwizard.com/video/futuristic-data-analytics-with-bar-graphs-and-trends/f4b2fdd6816ba07065a32b4ff5704393/>PikWizard</a>
</span>
</span>
<span class="image-link">
<span
style="margin: 0 0 20px 0; display: inline-block; vertical-align: middle; width: 100%;"
>
<a
target="_blank"
href="https://pikwizard.com/video/futuristic-data-analytics-with-bar-graphs-and-trends/f4b2fdd6816ba07065a32b4ff5704393/"
style="text-decoration: none; font-size: 10px; margin: 0;"
>
<video controls style="width: 100%; margin: 0;">
<source src="https://player.vimeo.com/progressive_redirect/playback/736756537/rendition/240p/file.mp4?loc=external&oauth2_token_id=1223210874&signature=c59fc285fd6012ad1ce164dde0849c9ed4dadaeb79bc37469f31d9d3bc84be42" type="video/mp4"
poster="https://pikwizard.com/pw/medium/f4b2fdd6816ba07065a32b4ff5704393.jpg"/>
Your browser does not support the video tag.
</video>
<p style="font-size: 12px; margin: 0;">PikWizard</p>
</a>
</span>
</span>
Free (free of charge)
Free for personal and commercial use.
Author: Awesome Content