
- Home >
- Stock Videos >
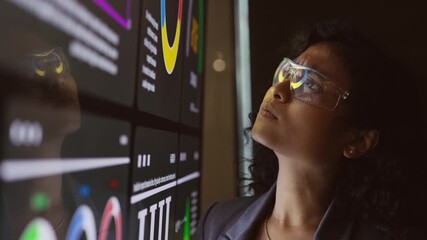
- Futuristic Data Visualization in Purple Tones
Futuristic Data Visualization in Purple Tones Video

This is a stylized representation of data visualization, featuring pie charts and abstract graphs on a purple background. The futuristic style emphasizes innovation and advanced technology. Ideal for presentations on digital media trends, tech projects, business reports, or analysis platforms.
Powered by 


downloads
Tags:
More
Credit Photo
If you would like to credit the Photo, here are some ways you can do so
Text Link
video Link
<span class="text-link">
<span>
<a target="_blank" href=https://pikwizard.com/video/futuristic-data-visualization-in-purple-tones/e611e16e2ffdc8a783ead29b4c143fc9/>PikWizard</a>
</span>
</span>
<span class="image-link">
<span
style="margin: 0 0 20px 0; display: inline-block; vertical-align: middle; width: 100%;"
>
<a
target="_blank"
href="https://pikwizard.com/video/futuristic-data-visualization-in-purple-tones/e611e16e2ffdc8a783ead29b4c143fc9/"
style="text-decoration: none; font-size: 10px; margin: 0;"
>
<video controls style="width: 100%; margin: 0;">
<source src="https://player.vimeo.com/progressive_redirect/playback/772033340/rendition/240p/file.mp4?loc=external&oauth2_token_id=1223210874&signature=792ee99137953ea9b3d5f5bd3d422e6a7bb4d258a393575a499ce7604d716d2d" type="video/mp4"
poster="https://pikwizard.com/pw/medium/e611e16e2ffdc8a783ead29b4c143fc9.jpg"/>
Your browser does not support the video tag.
</video>
<p style="font-size: 12px; margin: 0;">PikWizard</p>
</a>
</span>
</span>
Free (free of charge)
Free for personal and commercial use.
Author: Awesome Content