
- Home >
- Stock Videos >
- Futuristic Data Visualization Interface with Bar and Line Graphs
Futuristic Data Visualization Interface with Bar and Line Graphs Video
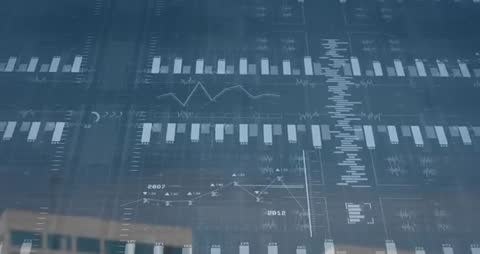
Visual offers a modern depiction of data analytics with transparent interface and dynamic bar and line graphs. Ideal for illustrating topics on futuristic technology, data visualization, or corporate analytics in presentations, reports, and website headers.

downloads
Tags:
More
Credit Photo
If you would like to credit the Photo, here are some ways you can do so
Text Link
video Link
<span class="text-link">
<span>
<a target="_blank" href=https://pikwizard.com/video/futuristic-data-visualization-interface-with-bar-and-line-graphs/d552bd6d4027e68e7a52e046572ae166/>PikWizard</a>
</span>
</span>
<span class="image-link">
<span
style="margin: 0 0 20px 0; display: inline-block; vertical-align: middle; width: 100%;"
>
<a
target="_blank"
href="https://pikwizard.com/video/futuristic-data-visualization-interface-with-bar-and-line-graphs/d552bd6d4027e68e7a52e046572ae166/"
style="text-decoration: none; font-size: 10px; margin: 0;"
>
<video controls style="width: 100%; margin: 0;">
<source src="https://player.vimeo.com/progressive_redirect/playback/1078025172/rendition/240p/file.mp4?loc=external&oauth2_token_id=1223210874&signature=f81882f7f4097620bff0d3acf9f3c0698397f2bd64815c1c1fab4e9e43ea1c29" type="video/mp4"
poster="https://pikwizard.com/pw/medium/d552bd6d4027e68e7a52e046572ae166.jpg"/>
Your browser does not support the video tag.
</video>
<p style="font-size: 12px; margin: 0;">PikWizard</p>
</a>
</span>
</span>
Free (free of charge)
Free for personal and commercial use.
Author: Awesome Content