
- Home >
- Stock Videos >
- Futuristic Data Visualization Interface with Line Chart in HUD
Futuristic Data Visualization Interface with Line Chart in HUD Video
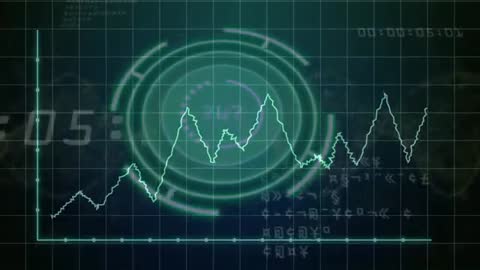
Neon green heads-up display shows an animated jagged line chart. Represents concepts like complex data analysis, financial forecasting, and technological advancement. Useful for media related to finance, technology firm promotions, or futuristic themes.
Powered by  - Get 15% off with code: PIKWIZARD15


downloads
Tags:
More
Credit Photo
If you would like to credit the Photo, here are some ways you can do so
Text Link
video Link
<span class="text-link">
<span>
<a target="_blank" href=https://pikwizard.com/video/futuristic-data-visualization-interface-with-line-chart-in-hud/7eafa770bcf8992965a604842b5a2f4b/>PikWizard</a>
</span>
</span>
<span class="image-link">
<span
style="margin: 0 0 20px 0; display: inline-block; vertical-align: middle; width: 100%;"
>
<a
target="_blank"
href="https://pikwizard.com/video/futuristic-data-visualization-interface-with-line-chart-in-hud/7eafa770bcf8992965a604842b5a2f4b/"
style="text-decoration: none; font-size: 10px; margin: 0;"
>
<video controls style="width: 100%; margin: 0;">
<source src="https://player.vimeo.com/progressive_redirect/playback/1084939740/rendition/240p/file.mp4?loc=external&oauth2_token_id=1223210874&signature=a8c2d423cb0cf6a26176a9a1186f72b1bb4dd2047143c93094274077f0b72c6c" type="video/mp4"
poster="https://pikwizard.com/pw/medium/7eafa770bcf8992965a604842b5a2f4b.jpg"/>
Your browser does not support the video tag.
</video>
<p style="font-size: 12px; margin: 0;">PikWizard</p>
</a>
</span>
</span>
Free (free of charge)
Free for personal and commercial use.
Author: Awesome Content