
- Home >
- Stock Videos >
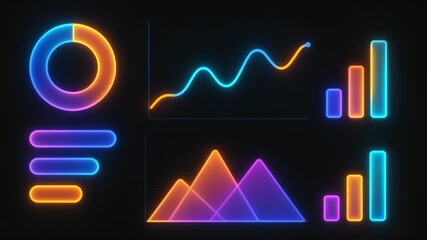
- Futuristic Data Visualization With Blue Bar and Pie Charts
Futuristic Data Visualization With Blue Bar and Pie Charts Video

Bar and pie charts render professional data-centric themes, ideal for representing business statistics, financial data, or economic trends. Suitable for use in presentations, educational materials, or reports requiring visual aids to enhance understanding of complex information.
Powered by 


downloads
Tags:
More
Credit Photo
If you would like to credit the Photo, here are some ways you can do so
Text Link
video Link
<span class="text-link">
<span>
<a target="_blank" href=https://pikwizard.com/video/futuristic-data-visualization-with-blue-bar-and-pie-charts/ede8973db81e04abbc39b6907db4ac54/>PikWizard</a>
</span>
</span>
<span class="image-link">
<span
style="margin: 0 0 20px 0; display: inline-block; vertical-align: middle; width: 100%;"
>
<a
target="_blank"
href="https://pikwizard.com/video/futuristic-data-visualization-with-blue-bar-and-pie-charts/ede8973db81e04abbc39b6907db4ac54/"
style="text-decoration: none; font-size: 10px; margin: 0;"
>
<video controls style="width: 100%; margin: 0;">
<source src="https://player.vimeo.com/progressive_redirect/playback/982868408/rendition/240p/file.mp4?loc=external&oauth2_token_id=1223210874&signature=4f5e6c8114dcd28ad68644d2b3547faa0aaf4f2565aa6d49c6d02b9221d24113" type="video/mp4"
poster="https://pikwizard.com/pw/medium/ede8973db81e04abbc39b6907db4ac54.jpg"/>
Your browser does not support the video tag.
</video>
<p style="font-size: 12px; margin: 0;">PikWizard</p>
</a>
</span>
</span>
Free (free of charge)
Free for personal and commercial use.
Author: Awesome Content