
- Home >
- Stock Videos >
- Futuristic Data Visualization with Complex Graphs and Equations
Futuristic Data Visualization with Complex Graphs and Equations Video
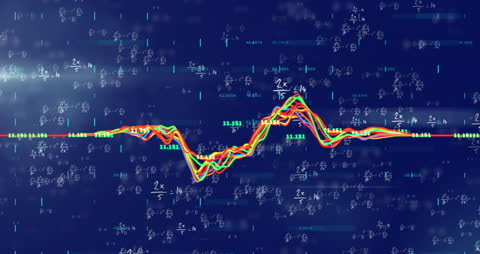
Digital graphic displays a dynamic graph with blue data blocks and numerical changes on a dark background, suggesting representing global data processing complex in digital interface. Ideal for depicting modern technology, big data analysis, and advanced algorithm visualizations. Use in presentations about future computing, digital metrics, and innovation in data science.

downloads
Tags:
More
Credit Photo
If you would like to credit the Photo, here are some ways you can do so
Text Link
video Link
<span class="text-link">
<span>
<a target="_blank" href=https://pikwizard.com/video/futuristic-data-visualization-with-complex-graphs-and-equations/6098fca9305b5ea98d0f8af082d039f6/>PikWizard</a>
</span>
</span>
<span class="image-link">
<span
style="margin: 0 0 20px 0; display: inline-block; vertical-align: middle; width: 100%;"
>
<a
target="_blank"
href="https://pikwizard.com/video/futuristic-data-visualization-with-complex-graphs-and-equations/6098fca9305b5ea98d0f8af082d039f6/"
style="text-decoration: none; font-size: 10px; margin: 0;"
>
<video controls style="width: 100%; margin: 0;">
<source src="https://player.vimeo.com/progressive_redirect/playback/798521320/rendition/240p/file.mp4?loc=external&oauth2_token_id=1223210874&signature=c11ce2f837b8b2cacda29d5bc3d537dfc93c6c9e9b9e7f5e8b0180a42dec7bef" type="video/mp4"
poster="https://pikwizard.com/pw/medium/6098fca9305b5ea98d0f8af082d039f6.jpg"/>
Your browser does not support the video tag.
</video>
<p style="font-size: 12px; margin: 0;">PikWizard</p>
</a>
</span>
</span>
Free (free of charge)
Free for personal and commercial use.
Author: Awesome Content