
- Home >
- Stock Videos >
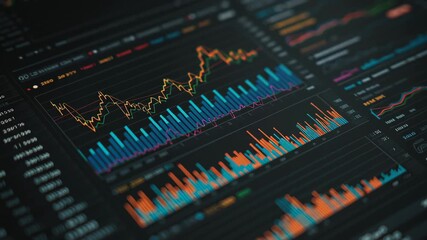
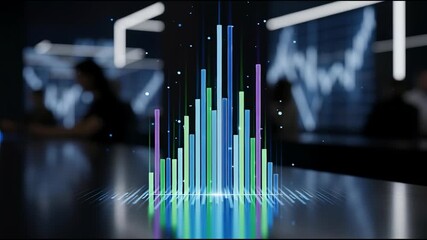
- Futuristic Data Visualization with Digital Graphs and Charts
Futuristic Data Visualization with Digital Graphs and Charts Video
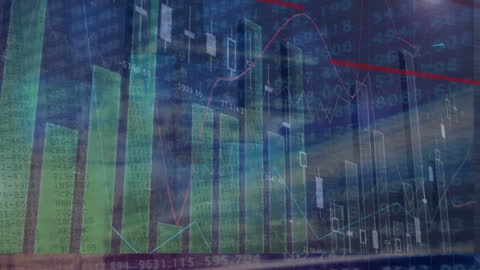
Dynamic representation of digital data with overlapping graphs and charts in a futuristic style. Suitable for use in presentations, financial analysis reports, or technology blogs to convey concepts related to data science, analytics, and innovation.
Powered by 


downloads
Tags:
More
Credit Photo
If you would like to credit the Photo, here are some ways you can do so
Text Link
video Link
<span class="text-link">
<span>
<a target="_blank" href=https://pikwizard.com/video/futuristic-data-visualization-with-digital-graphs-and-charts/23c0bf8f339d65765cd94611497849e7/>PikWizard</a>
</span>
</span>
<span class="image-link">
<span
style="margin: 0 0 20px 0; display: inline-block; vertical-align: middle; width: 100%;"
>
<a
target="_blank"
href="https://pikwizard.com/video/futuristic-data-visualization-with-digital-graphs-and-charts/23c0bf8f339d65765cd94611497849e7/"
style="text-decoration: none; font-size: 10px; margin: 0;"
>
<video controls style="width: 100%; margin: 0;">
<source src="https://player.vimeo.com/progressive_redirect/playback/778513243/rendition/240p/file.mp4?loc=external&oauth2_token_id=1223210874&signature=eead2ecd0aace81ba6c6f972152f19ad7b256a7e9acc2211ff130c6eb1dac5c1" type="video/mp4"
poster="https://pikwizard.com/pw/medium/23c0bf8f339d65765cd94611497849e7.jpg"/>
Your browser does not support the video tag.
</video>
<p style="font-size: 12px; margin: 0;">PikWizard</p>
</a>
</span>
</span>
Free (free of charge)
Free for personal and commercial use.
Author: Awesome Content