
- Home >
- Stock Videos >
- Futuristic Data Visualization with Globe and Stock Tickers Spinning
Futuristic Data Visualization with Globe and Stock Tickers Spinning Video
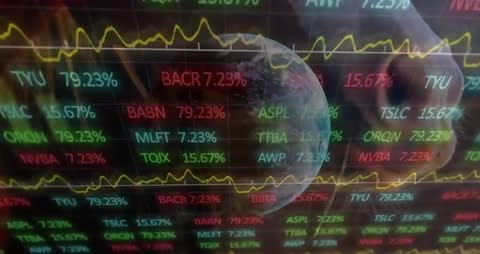
This visual showcases an innovative digital interface where a spinning globe overlays fluctuating stock tickers. It creates a dynamic and modern representation of global financial markets and data trends. Ideal for tech-focused presentations or educational material about financial analytics and technology.
Powered by 


downloads
Tags:
More
Credit Photo
If you would like to credit the Photo, here are some ways you can do so
Text Link
video Link
<span class="text-link">
<span>
<a target="_blank" href=https://pikwizard.com/video/futuristic-data-visualization-with-globe-and-stock-tickers-spinning/a3d71bc3de3c4fc3f22f14e7fe9fadb0/>PikWizard</a>
</span>
</span>
<span class="image-link">
<span
style="margin: 0 0 20px 0; display: inline-block; vertical-align: middle; width: 100%;"
>
<a
target="_blank"
href="https://pikwizard.com/video/futuristic-data-visualization-with-globe-and-stock-tickers-spinning/a3d71bc3de3c4fc3f22f14e7fe9fadb0/"
style="text-decoration: none; font-size: 10px; margin: 0;"
>
<video controls style="width: 100%; margin: 0;">
<source src="https://player.vimeo.com/progressive_redirect/playback/1130272155/rendition/240p/file.mp4?loc=external&oauth2_token_id=1223210874&signature=48ba26dc53d2254cb62e4c6a44d0ae9a9c09e3ef56e772305db4a2f0a8e0c010" type="video/mp4"
poster="https://pikwizard.com/pw/medium/a3d71bc3de3c4fc3f22f14e7fe9fadb0.jpg"/>
Your browser does not support the video tag.
</video>
<p style="font-size: 12px; margin: 0;">PikWizard</p>
</a>
</span>
</span>
Free (free of charge)
Free for personal and commercial use.
Author: Awesome Content