
- Home >
- Stock Videos >
- Futuristic Data Visualization with Graphs and Maps
Futuristic Data Visualization with Graphs and Maps Video
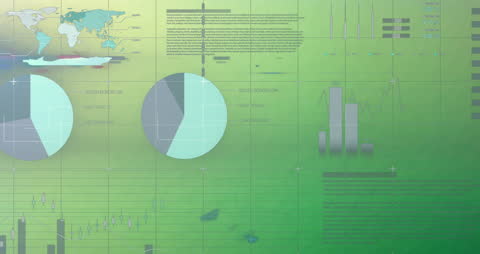
This illustration depicts a futuristic digital interface featuring various data visualizations such as graphs, maps, and charts against a green background, symbolizing depth in data analytics. Ideal for use in presentations on technology advancements, financial platforms, business statistics, corporate reports, or in education materials illustrating modern data processing techniques.
Powered by  - Get 15% off with code: PIKWIZARD15


downloads
Tags:
More
Credit Photo
If you would like to credit the Photo, here are some ways you can do so
Text Link
video Link
<span class="text-link">
<span>
<a target="_blank" href=https://pikwizard.com/video/futuristic-data-visualization-with-graphs-and-maps/d12abc0f95fe98ce3d72f117a87ce6d4/>PikWizard</a>
</span>
</span>
<span class="image-link">
<span
style="margin: 0 0 20px 0; display: inline-block; vertical-align: middle; width: 100%;"
>
<a
target="_blank"
href="https://pikwizard.com/video/futuristic-data-visualization-with-graphs-and-maps/d12abc0f95fe98ce3d72f117a87ce6d4/"
style="text-decoration: none; font-size: 10px; margin: 0;"
>
<video controls style="width: 100%; margin: 0;">
<source src="https://player.vimeo.com/progressive_redirect/playback/739570038/rendition/240p/file.mp4?loc=external&oauth2_token_id=1223210874&signature=3acf576fd89758d6771dc0015c3532ece2dce39f8f2b40d0f40f76d97642d5fd" type="video/mp4"
poster="https://pikwizard.com/pw/medium/d12abc0f95fe98ce3d72f117a87ce6d4.jpg"/>
Your browser does not support the video tag.
</video>
<p style="font-size: 12px; margin: 0;">PikWizard</p>
</a>
</span>
</span>
Free (free of charge)
Free for personal and commercial use.
Author: Awesome Content