
- Home >
- Stock Videos >
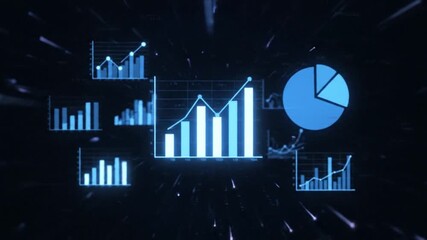
- Futuristic Digital Data Visualization for Business Growth Analysis
Futuristic Digital Data Visualization for Business Growth Analysis Video
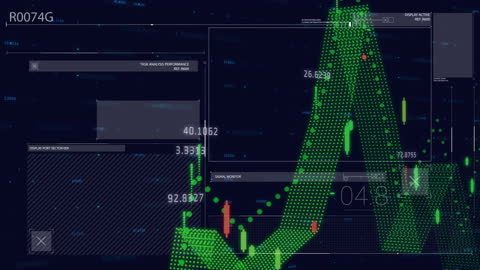
Visualizing futuristic business data through digital graphs with emphasis on growth patterns and analysis. Green pixelated digital bars and graphs against a dark technological background convey advanced analytics. Perfect for use in presentations on business strategy, data analysis processes, infographics, or illustrating modern technology themes.
Powered by 


downloads
Tags:
More
Credit Photo
If you would like to credit the Photo, here are some ways you can do so
Text Link
video Link
<span class="text-link">
<span>
<a target="_blank" href=https://pikwizard.com/video/futuristic-digital-data-visualization-for-business-growth-analysis/ff555d94f7a2f1909e1b237e08dbf783/>PikWizard</a>
</span>
</span>
<span class="image-link">
<span
style="margin: 0 0 20px 0; display: inline-block; vertical-align: middle; width: 100%;"
>
<a
target="_blank"
href="https://pikwizard.com/video/futuristic-digital-data-visualization-for-business-growth-analysis/ff555d94f7a2f1909e1b237e08dbf783/"
style="text-decoration: none; font-size: 10px; margin: 0;"
>
<video controls style="width: 100%; margin: 0;">
<source src="https://player.vimeo.com/progressive_redirect/playback/743617168/rendition/240p/file.mp4?loc=external&oauth2_token_id=1223210874&signature=afdd77325706db9fd28ae1ede5dedd44ec9a48e09c5f25a858fd9a202d78a197" type="video/mp4"
poster="https://pikwizard.com/pw/medium/ff555d94f7a2f1909e1b237e08dbf783.jpg"/>
Your browser does not support the video tag.
</video>
<p style="font-size: 12px; margin: 0;">PikWizard</p>
</a>
</span>
</span>
Free (free of charge)
Free for personal and commercial use.
Author: Awesome Content