
- Home >
- Stock Videos >
- Futuristic Digital Finance Graphs and Technology Visualization
Futuristic Digital Finance Graphs and Technology Visualization Video
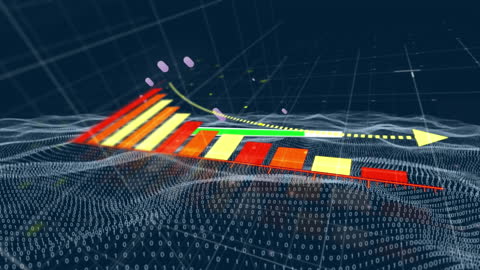
This visual shows dynamic graphs, colorful bars, and circles in a digital setting enriched by waves of technology, ideal for materials in global finance, economics, and technology. Use in media presentations, financial analyses, or educational content illustrating technological advancements in the financial sector.
Powered by 


downloads
Tags:
More
Credit Photo
If you would like to credit the Photo, here are some ways you can do so
Text Link
video Link
<span class="text-link">
<span>
<a target="_blank" href=https://pikwizard.com/video/futuristic-digital-finance-graphs-and-technology-visualization/ce4121cc475427863af970f9e234a24f/>PikWizard</a>
</span>
</span>
<span class="image-link">
<span
style="margin: 0 0 20px 0; display: inline-block; vertical-align: middle; width: 100%;"
>
<a
target="_blank"
href="https://pikwizard.com/video/futuristic-digital-finance-graphs-and-technology-visualization/ce4121cc475427863af970f9e234a24f/"
style="text-decoration: none; font-size: 10px; margin: 0;"
>
<video controls style="width: 100%; margin: 0;">
<source src="https://player.vimeo.com/progressive_redirect/playback/741058799/rendition/240p/file.mp4?loc=external&oauth2_token_id=1223210874&signature=7083be9ed7d816011e0c9cfd88feea92a21c7bbc4b957492a30675c53883830c" type="video/mp4"
poster="https://pikwizard.com/pw/medium/ce4121cc475427863af970f9e234a24f.jpg"/>
Your browser does not support the video tag.
</video>
<p style="font-size: 12px; margin: 0;">PikWizard</p>
</a>
</span>
</span>
Free (free of charge)
Free for personal and commercial use.
Author: Awesome Content