
- Home >
- Stock Videos >
- Futuristic Financial Analysis Concept with Data Graphs
Futuristic Financial Analysis Concept with Data Graphs Video
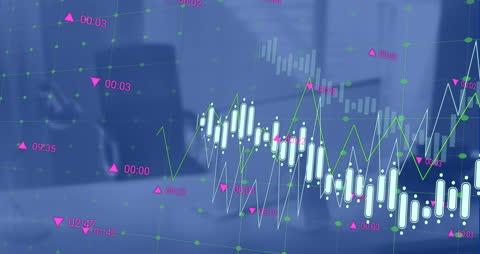
Electronic wave of financial data morphing behind office setting filled with graphs and analysis tools prevalent in corporate strategy and market trend evaluation. This is a perfect illustration for technology-driven financial representations, making it ideal for presentations on economic forecasting, stock analytics, and apps focused on investment portfolios.
Powered by 


downloads
Tags:
More
Credit Photo
If you would like to credit the Photo, here are some ways you can do so
Text Link
video Link
<span class="text-link">
<span>
<a target="_blank" href=https://pikwizard.com/video/futuristic-financial-analysis-concept-with-data-graphs/24724666f45cf65c8af176c07b30a85e/>PikWizard</a>
</span>
</span>
<span class="image-link">
<span
style="margin: 0 0 20px 0; display: inline-block; vertical-align: middle; width: 100%;"
>
<a
target="_blank"
href="https://pikwizard.com/video/futuristic-financial-analysis-concept-with-data-graphs/24724666f45cf65c8af176c07b30a85e/"
style="text-decoration: none; font-size: 10px; margin: 0;"
>
<video controls style="width: 100%; margin: 0;">
<source src="https://player.vimeo.com/progressive_redirect/playback/814773803/rendition/240p/file.mp4?loc=external&oauth2_token_id=1223210874&signature=eb5a903ba1c563491aba1143ab8f5e1fd3fb86c7d0094e49dff7a4a7680a882e" type="video/mp4"
poster="https://pikwizard.com/pw/medium/24724666f45cf65c8af176c07b30a85e.jpg"/>
Your browser does not support the video tag.
</video>
<p style="font-size: 12px; margin: 0;">PikWizard</p>
</a>
</span>
</span>
Free (free of charge)
Free for personal and commercial use.
Author: Awesome Content