
- Home >
- Stock Videos >
- Futuristic Financial Data Chart with Blue Hexagonal Pattern
Futuristic Financial Data Chart with Blue Hexagonal Pattern Video
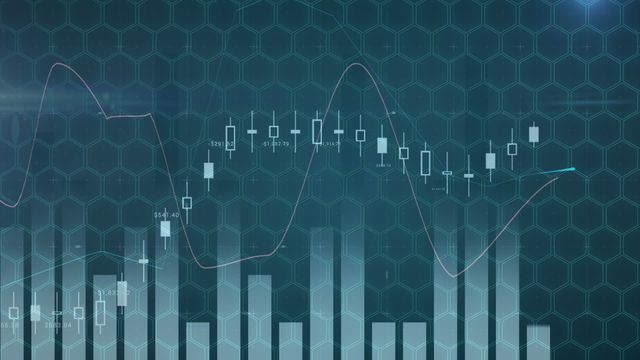
Image features a financial chart with candlestick markers and data lines, set against a modern blue hexagonal background. Ideal for use in presentations, reports, or articles related to economic trends, stock market analysis, data analysis technology, or financial growth. Suitable for business professionals seeking contemporary aesthetics in data visualization tools.
Powered by  - Get 15% off with code: PIKWIZARD15


downloads
Tags:
More
Credit Photo
If you would like to credit the Photo, here are some ways you can do so
Text Link
video Link
<span class="text-link">
<span>
<a target="_blank" href=https://pikwizard.com/video/futuristic-financial-data-chart-with-blue-hexagonal-pattern/d08c7d6e57af80a66926246ad58b6e92/>PikWizard</a>
</span>
</span>
<span class="image-link">
<span
style="margin: 0 0 20px 0; display: inline-block; vertical-align: middle; width: 100%;"
>
<a
target="_blank"
href="https://pikwizard.com/video/futuristic-financial-data-chart-with-blue-hexagonal-pattern/d08c7d6e57af80a66926246ad58b6e92/"
style="text-decoration: none; font-size: 10px; margin: 0;"
>
<video controls style="width: 100%; margin: 0;">
<source src="https://player.vimeo.com/progressive_redirect/playback/718751118/rendition/240p/file.mp4?loc=external&oauth2_token_id=1223210874&signature=2cf49e98ff0945fc915bb845acb5b146e89bb969abfba51dd238a4e61c6ef046" type="video/mp4"
poster="https://pikwizard.com/pw/medium/d08c7d6e57af80a66926246ad58b6e92.jpg"/>
Your browser does not support the video tag.
</video>
<p style="font-size: 12px; margin: 0;">PikWizard</p>
</a>
</span>
</span>
Free (free of charge)
Free for personal and commercial use.
Author: Awesome Content