
- Home >
- Stock Videos >
- Futuristic Financial Data Graph with Globe Connections
Futuristic Financial Data Graph with Globe Connections Video
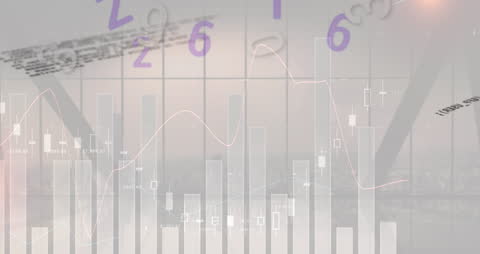
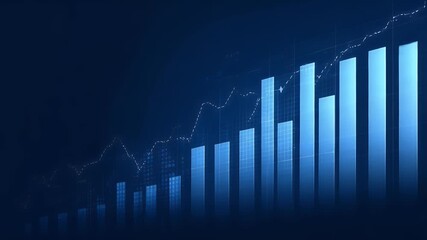
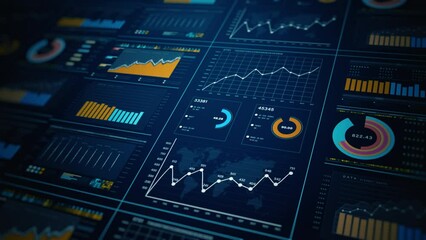
Overlay of financial data graphs with globe networking represents the concept of global digital networks in economic analysis. Effective for portraying connections in business, finance, trading, and economic systems.
Powered by 


downloads
Tags:
More
Credit Photo
If you would like to credit the Photo, here are some ways you can do so
Text Link
video Link
<span class="text-link">
<span>
<a target="_blank" href=https://pikwizard.com/video/futuristic-financial-data-graph-with-globe-connections/9db0f5892adbe94c4a82bcd0f1f9d6ba/>PikWizard</a>
</span>
</span>
<span class="image-link">
<span
style="margin: 0 0 20px 0; display: inline-block; vertical-align: middle; width: 100%;"
>
<a
target="_blank"
href="https://pikwizard.com/video/futuristic-financial-data-graph-with-globe-connections/9db0f5892adbe94c4a82bcd0f1f9d6ba/"
style="text-decoration: none; font-size: 10px; margin: 0;"
>
<video controls style="width: 100%; margin: 0;">
<source src="https://player.vimeo.com/progressive_redirect/playback/719123220/rendition/240p/file.mp4?loc=external&oauth2_token_id=1223210874&signature=076c8dc231a91375ba8bdeb060e6100a8cef99099ce60b34441137c4065e0766" type="video/mp4"
poster="https://pikwizard.com/pw/medium/9db0f5892adbe94c4a82bcd0f1f9d6ba.jpg"/>
Your browser does not support the video tag.
</video>
<p style="font-size: 12px; margin: 0;">PikWizard</p>
</a>
</span>
</span>
Free (free of charge)
Free for personal and commercial use.
Author: Awesome Content