
- Home >
- Stock Videos >
- Futuristic Financial Data Visualization with Bar and Line Graphs
Futuristic Financial Data Visualization with Bar and Line Graphs Video
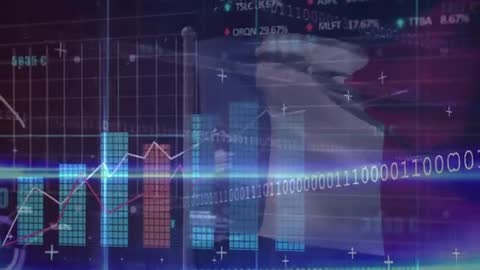
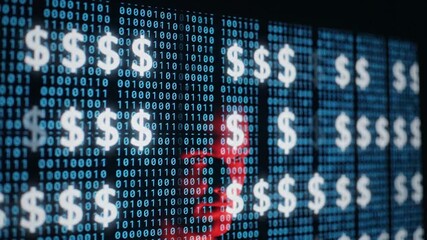
Futuristic theme illustrating financial data with a blend of digital elements such as binary code, bar charts, and line graphs. This visual can be used to represent data analytics, technology-based investment themes, or to enhance content focusing on digital finance, proactive financial management, and technological advancements in business sectors. It is ideal for publications, futuristic technology websites, and financial service presentations discussing the integration of data visualization in the financial industry.
Powered by 


downloads
Tags:
More
Credit Photo
If you would like to credit the Photo, here are some ways you can do so
Text Link
video Link
<span class="text-link">
<span>
<a target="_blank" href=https://pikwizard.com/video/futuristic-financial-data-visualization-with-bar-and-line-graphs/56d231b98aa34119cad4f097ffdee426/>PikWizard</a>
</span>
</span>
<span class="image-link">
<span
style="margin: 0 0 20px 0; display: inline-block; vertical-align: middle; width: 100%;"
>
<a
target="_blank"
href="https://pikwizard.com/video/futuristic-financial-data-visualization-with-bar-and-line-graphs/56d231b98aa34119cad4f097ffdee426/"
style="text-decoration: none; font-size: 10px; margin: 0;"
>
<video controls style="width: 100%; margin: 0;">
<source src="https://player.vimeo.com/progressive_redirect/playback/1088677720/rendition/240p/file.mp4?loc=external&oauth2_token_id=1223210874&signature=e0ecb78e714eeb8aa6a635c7f954686211f226e04be05ead3cecc066d374b462" type="video/mp4"
poster="https://pikwizard.com/pw/medium/56d231b98aa34119cad4f097ffdee426.jpg"/>
Your browser does not support the video tag.
</video>
<p style="font-size: 12px; margin: 0;">PikWizard</p>
</a>
</span>
</span>
Free (free of charge)
Free for personal and commercial use.
Author: Awesome Content