
- Home >
- Stock Videos >
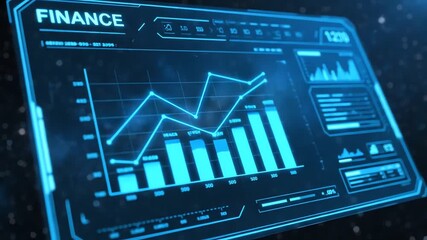
- Futuristic Financial Data Visualization with Graphs and Dots
Futuristic Financial Data Visualization with Graphs and Dots Video

Capturing a detailed animation of global financial data with dynamic graphs and connecting dots, this representation illustrates technological advancement and connectivity in the financial sector. Ideal for use in presentations about business strategies, blockchain technology, or data analytics. Provides a visual motif that symbolizes the interconnected, digital nature of modern finance and global markets.
Powered by 


downloads
Tags:
More
Credit Photo
If you would like to credit the Photo, here are some ways you can do so
Text Link
video Link
<span class="text-link">
<span>
<a target="_blank" href=https://pikwizard.com/video/futuristic-financial-data-visualization-with-graphs-and-dots/ff8ce4c8638e0f6634dcdc341a574f03/>PikWizard</a>
</span>
</span>
<span class="image-link">
<span
style="margin: 0 0 20px 0; display: inline-block; vertical-align: middle; width: 100%;"
>
<a
target="_blank"
href="https://pikwizard.com/video/futuristic-financial-data-visualization-with-graphs-and-dots/ff8ce4c8638e0f6634dcdc341a574f03/"
style="text-decoration: none; font-size: 10px; margin: 0;"
>
<video controls style="width: 100%; margin: 0;">
<source src="https://player.vimeo.com/progressive_redirect/playback/744035114/rendition/240p/file.mp4?loc=external&oauth2_token_id=1223210874&signature=18911cbe08f58dec088877967a8ce05020823a3c71d9b7dc339b03aa4511f749" type="video/mp4"
poster="https://pikwizard.com/pw/medium/ff8ce4c8638e0f6634dcdc341a574f03.jpg"/>
Your browser does not support the video tag.
</video>
<p style="font-size: 12px; margin: 0;">PikWizard</p>
</a>
</span>
</span>
Free (free of charge)
Free for personal and commercial use.
Author: Awesome Content