
- Home >
- Stock Videos >
- Futuristic Financial Data Visualizations on Global Map
Futuristic Financial Data Visualizations on Global Map Video

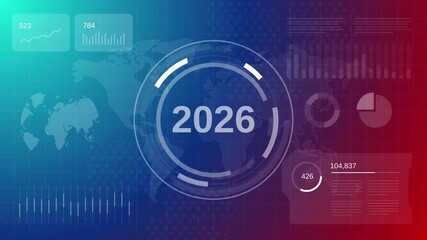
Financial information and data analytics colorful patterns overlaid on globe video with landmarks and currency in background. Visual elements include bar graphs, pie charts, and statistical indicators symbolizing economic dynamics and global market analysis. Useful for illustrating financial trends, business technology usage, economic news graphics, or corporate presentations emphasizing analytics in a global context.
Powered by 


downloads
Tags:
More
Credit Photo
If you would like to credit the Photo, here are some ways you can do so
Text Link
video Link
<span class="text-link">
<span>
<a target="_blank" href=https://pikwizard.com/video/futuristic-financial-data-visualizations-on-global-map/d668108ac77d2822756b1a6b2bbd81b7/>PikWizard</a>
</span>
</span>
<span class="image-link">
<span
style="margin: 0 0 20px 0; display: inline-block; vertical-align: middle; width: 100%;"
>
<a
target="_blank"
href="https://pikwizard.com/video/futuristic-financial-data-visualizations-on-global-map/d668108ac77d2822756b1a6b2bbd81b7/"
style="text-decoration: none; font-size: 10px; margin: 0;"
>
<video controls style="width: 100%; margin: 0;">
<source src="https://player.vimeo.com/progressive_redirect/playback/771147088/rendition/240p/file.mp4?loc=external&oauth2_token_id=1223210874&signature=bc3dd5bc0495ddac2313df2fd86d7396b318e300f7fcb9c51986ab97b3804621" type="video/mp4"
poster="https://pikwizard.com/pw/medium/d668108ac77d2822756b1a6b2bbd81b7.jpg"/>
Your browser does not support the video tag.
</video>
<p style="font-size: 12px; margin: 0;">PikWizard</p>
</a>
</span>
</span>
Free (free of charge)
Free for personal and commercial use.
Author: Awesome Content