
- Home >
- Stock Videos >
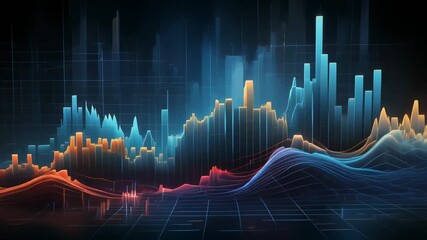
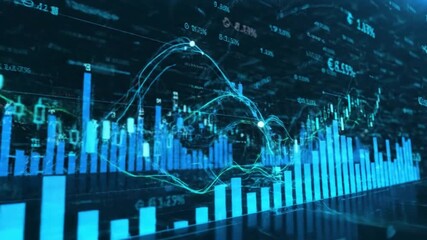
- Futuristic Financial Graph Animation with Data Visualizations
Futuristic Financial Graph Animation with Data Visualizations Video
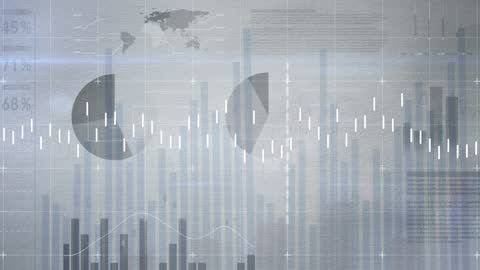
This dynamic visualization showcases futuristic financial graphs and analytics, including moving lines, bar graphs, and pie charts. Suitable for illustrating concepts in financial growth, stock market data, and business technology advancements. Ideal for presentations, articles, or videos related to finance, data analysis, and technological development in business.
Powered by 


downloads
Tags:
More
Credit Photo
If you would like to credit the Photo, here are some ways you can do so
Text Link
video Link
<span class="text-link">
<span>
<a target="_blank" href=https://pikwizard.com/video/futuristic-financial-graph-animation-with-data-visualizations/c4c37208f87d61f822b29f70f94a0ba4/>PikWizard</a>
</span>
</span>
<span class="image-link">
<span
style="margin: 0 0 20px 0; display: inline-block; vertical-align: middle; width: 100%;"
>
<a
target="_blank"
href="https://pikwizard.com/video/futuristic-financial-graph-animation-with-data-visualizations/c4c37208f87d61f822b29f70f94a0ba4/"
style="text-decoration: none; font-size: 10px; margin: 0;"
>
<video controls style="width: 100%; margin: 0;">
<source src="https://player.vimeo.com/progressive_redirect/playback/758819608/rendition/240p/file.mp4?loc=external&oauth2_token_id=1223210874&signature=02f8ed768e42f2629468f8146f2e704a88b0aae777d0b4ba1d69f9dc196878ee" type="video/mp4"
poster="https://pikwizard.com/pw/medium/c4c37208f87d61f822b29f70f94a0ba4.jpg"/>
Your browser does not support the video tag.
</video>
<p style="font-size: 12px; margin: 0;">PikWizard</p>
</a>
</span>
</span>
Free (free of charge)
Free for personal and commercial use.
Author: Awesome Content