
- Home >
- Stock Videos >
- Futuristic Financial Graph with Digital Data Visualization
Futuristic Financial Graph with Digital Data Visualization Video
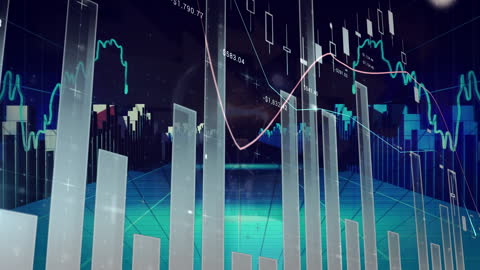
A futuristic depiction of financial graphs and data streams, embodying digital information visualisation in a high-tech environment. The dynamic chart creates a visually appealing representation of real-time stock market data and economic analytics. Useful for presentations or backgrounds in projects related to financial technology, data analysis, and cutting-edge business solutions.
Powered by  - Get 15% off with code: PIKWIZARD15


downloads
Tags:
More
Credit Photo
If you would like to credit the Photo, here are some ways you can do so
Text Link
video Link
<span class="text-link">
<span>
<a target="_blank" href=https://pikwizard.com/video/futuristic-financial-graph-with-digital-data-visualization/88c556aa86ebfc431c095881c27512b8/>PikWizard</a>
</span>
</span>
<span class="image-link">
<span
style="margin: 0 0 20px 0; display: inline-block; vertical-align: middle; width: 100%;"
>
<a
target="_blank"
href="https://pikwizard.com/video/futuristic-financial-graph-with-digital-data-visualization/88c556aa86ebfc431c095881c27512b8/"
style="text-decoration: none; font-size: 10px; margin: 0;"
>
<video controls style="width: 100%; margin: 0;">
<source src="https://player.vimeo.com/progressive_redirect/playback/739957412/rendition/240p/file.mp4?loc=external&oauth2_token_id=1223210874&signature=41672cc39b791a56043af1a0d2297cb95d0b3e9398cab8f4151d25dfe4a2b64d" type="video/mp4"
poster="https://pikwizard.com/pw/medium/88c556aa86ebfc431c095881c27512b8.jpg"/>
Your browser does not support the video tag.
</video>
<p style="font-size: 12px; margin: 0;">PikWizard</p>
</a>
</span>
</span>
Free (free of charge)
Free for personal and commercial use.
Author: Awesome Content