
- Home >
- Stock Videos >
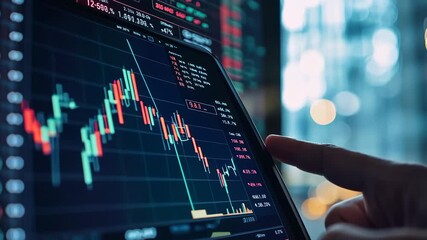
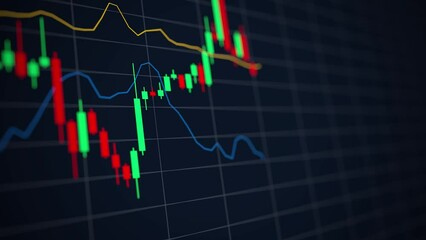
- Futuristic Financial Graphs and Charts in Investment Framework
Futuristic Financial Graphs and Charts in Investment Framework Video

Futuristic visuals depict dynamic financial graphs and data analysis in a multi-layered investment framework. Ideal for illustrating concepts related to the stock market, trading strategies, financial predictions, technological advancements in finance, or business analytic tools. Suitable for blog posts, financial websites, and educational materials on data-driven decision making and market insights.
Powered by 


6
downloads
downloads
Tags:
More
Credit Photo
If you would like to credit the Photo, here are some ways you can do so
Text Link
video Link
<span class="text-link">
<span>
<a target="_blank" href=https://pikwizard.com/video/futuristic-financial-graphs-and-charts-in-investment-framework/a05d767d37704c9aa10164ca7810ee8e/>PikWizard</a>
</span>
</span>
<span class="image-link">
<span
style="margin: 0 0 20px 0; display: inline-block; vertical-align: middle; width: 100%;"
>
<a
target="_blank"
href="https://pikwizard.com/video/futuristic-financial-graphs-and-charts-in-investment-framework/a05d767d37704c9aa10164ca7810ee8e/"
style="text-decoration: none; font-size: 10px; margin: 0;"
>
<video controls style="width: 100%; margin: 0;">
<source src="https://player.vimeo.com/progressive_redirect/playback/739970663/rendition/240p/file.mp4?loc=external&oauth2_token_id=1223210874&signature=317e2d930cd7cafeb861180522297d42cd620cd57434c3f33d4d3845b0645c19" type="video/mp4"
poster="https://pikwizard.com/pw/medium/a05d767d37704c9aa10164ca7810ee8e.jpg"/>
Your browser does not support the video tag.
</video>
<p style="font-size: 12px; margin: 0;">PikWizard</p>
</a>
</span>
</span>
Free (free of charge)
Free for personal and commercial use.
Author: Awesome Content