
- Home >
- Stock Videos >
- Futuristic Financial Graphs and Data Analysis
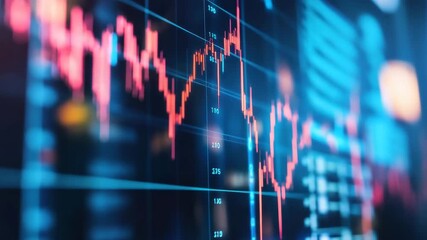
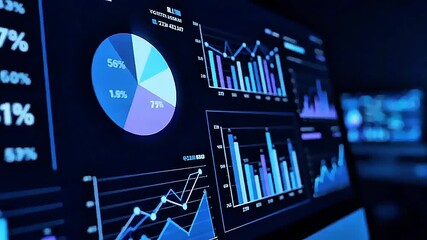
Futuristic Financial Graphs and Data Analysis Video
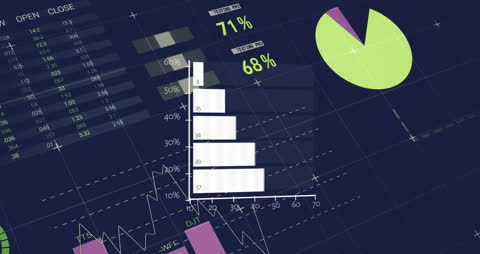
Digital depiction of financial data processing with graphical bar and pie charts. Useful for financial services proving insights and market research firms describing various economic indicators.
Powered by 


downloads
Tags:
More
Credit Photo
If you would like to credit the Photo, here are some ways you can do so
Text Link
video Link
<span class="text-link">
<span>
<a target="_blank" href=https://pikwizard.com/video/futuristic-financial-graphs-and-data-analysis/082f1019a19d45dadba98b5d6a942cfc/>PikWizard</a>
</span>
</span>
<span class="image-link">
<span
style="margin: 0 0 20px 0; display: inline-block; vertical-align: middle; width: 100%;"
>
<a
target="_blank"
href="https://pikwizard.com/video/futuristic-financial-graphs-and-data-analysis/082f1019a19d45dadba98b5d6a942cfc/"
style="text-decoration: none; font-size: 10px; margin: 0;"
>
<video controls style="width: 100%; margin: 0;">
<source src="https://player.vimeo.com/progressive_redirect/playback/840337976/rendition/240p/file.mp4?loc=external&oauth2_token_id=1223210874&signature=908763b579694f5a961ef815f6ee62b7255eebbb7ecc0c0275bb2374c1bf2862" type="video/mp4"
poster="https://pikwizard.com/pw/medium/082f1019a19d45dadba98b5d6a942cfc.jpg"/>
Your browser does not support the video tag.
</video>
<p style="font-size: 12px; margin: 0;">PikWizard</p>
</a>
</span>
</span>
Free (free of charge)
Free for personal and commercial use.
Author: Awesome Content