
- Home >
- Stock Videos >
- Futuristic Global Data Analytics and Visualization Screens
Futuristic Global Data Analytics and Visualization Screens Video
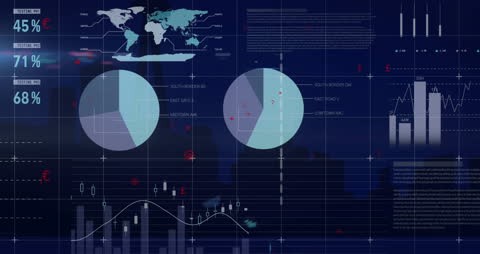
Visualizing a complex network of global data and analytics with futuristic digital interfaces. Bar charts, graphs, and pie charts displaying international business statistics across various metrics like percentages and regions. World map symbolizing global connectivity and access. Useful for illustrating themes of international business, digital technology, big data, and analytics in presentations, articles, and tech-related content.
Powered by 


downloads
Tags:
More
Credit Photo
If you would like to credit the Photo, here are some ways you can do so
Text Link
video Link
<span class="text-link">
<span>
<a target="_blank" href=https://pikwizard.com/video/futuristic-global-data-analytics-and-visualization-screens/95221adaf99553e2bf95e59308540d22/>PikWizard</a>
</span>
</span>
<span class="image-link">
<span
style="margin: 0 0 20px 0; display: inline-block; vertical-align: middle; width: 100%;"
>
<a
target="_blank"
href="https://pikwizard.com/video/futuristic-global-data-analytics-and-visualization-screens/95221adaf99553e2bf95e59308540d22/"
style="text-decoration: none; font-size: 10px; margin: 0;"
>
<video controls style="width: 100%; margin: 0;">
<source src="https://player.vimeo.com/progressive_redirect/playback/911375902/rendition/240p/file.mp4?loc=external&oauth2_token_id=1223210874&signature=d6557fcd2bd259e729af1e3eb76d28ba77b4c7ab15a73a5bba30d91188ffa36b" type="video/mp4"
poster="https://pikwizard.com/pw/medium/95221adaf99553e2bf95e59308540d22.jpg"/>
Your browser does not support the video tag.
</video>
<p style="font-size: 12px; margin: 0;">PikWizard</p>
</a>
</span>
</span>
Free (free of charge)
Free for personal and commercial use.
Author: Awesome Content