
- Home >
- Stock Videos >
- Futuristic Global Financial Data and Analytics Visualization
Futuristic Global Financial Data and Analytics Visualization Video
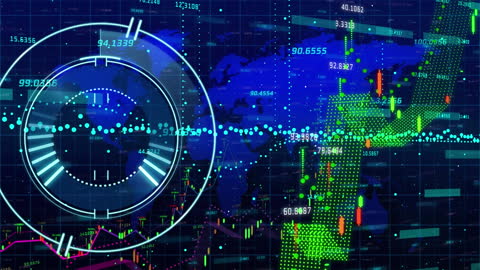
Complex presentation of multicolored graphs and financial data overlaying blue world map background. Includes digital radar, sonar elements, showcasing advanced data monitoring and interpretation. Ideal for illustrating concepts in global finance, business innovation, technological progress, stock market analysis, and data-driven decision making.

downloads
Tags:
More
Credit Photo
If you would like to credit the Photo, here are some ways you can do so
Text Link
video Link
<span class="text-link">
<span>
<a target="_blank" href=https://pikwizard.com/video/futuristic-global-financial-data-and-analytics-visualization/9915b949922f64c16bfc285f4d60f2d7/>PikWizard</a>
</span>
</span>
<span class="image-link">
<span
style="margin: 0 0 20px 0; display: inline-block; vertical-align: middle; width: 100%;"
>
<a
target="_blank"
href="https://pikwizard.com/video/futuristic-global-financial-data-and-analytics-visualization/9915b949922f64c16bfc285f4d60f2d7/"
style="text-decoration: none; font-size: 10px; margin: 0;"
>
<video controls style="width: 100%; margin: 0;">
<source src="https://player.vimeo.com/progressive_redirect/playback/909264868/rendition/240p/file.mp4?loc=external&oauth2_token_id=1223210874&signature=fe76bc424cbd10c9eb1bf60f6b87d5ace36eba64e7bcfc3f59333f821a4c6f78" type="video/mp4"
poster="https://pikwizard.com/pw/medium/9915b949922f64c16bfc285f4d60f2d7.jpg"/>
Your browser does not support the video tag.
</video>
<p style="font-size: 12px; margin: 0;">PikWizard</p>
</a>
</span>
</span>
Free (free of charge)
Free for personal and commercial use.
Author: Awesome Content