
- Home >
- Stock Videos >
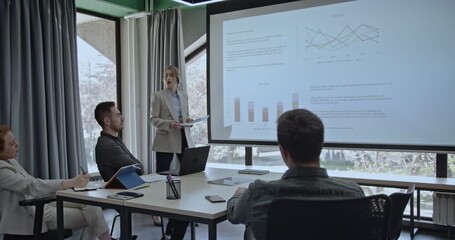
- Futuristic Graphs Showing Financial Data Overview
Futuristic Graphs Showing Financial Data Overview Video

Innovative representation of financial data and statistics, blending digital technology with an urban environment to symbolize modern business scenarios. Ideal for presentations on financial technology advancements, stock market trends, or economic analysis.
Powered by 


downloads
Tags:
More
Credit Photo
If you would like to credit the Photo, here are some ways you can do so
Text Link
video Link
<span class="text-link">
<span>
<a target="_blank" href=https://pikwizard.com/video/futuristic-graphs-showing-financial-data-overview/6df5eefc3693aa69d4263d509b50ccf5/>PikWizard</a>
</span>
</span>
<span class="image-link">
<span
style="margin: 0 0 20px 0; display: inline-block; vertical-align: middle; width: 100%;"
>
<a
target="_blank"
href="https://pikwizard.com/video/futuristic-graphs-showing-financial-data-overview/6df5eefc3693aa69d4263d509b50ccf5/"
style="text-decoration: none; font-size: 10px; margin: 0;"
>
<video controls style="width: 100%; margin: 0;">
<source src="https://player.vimeo.com/progressive_redirect/playback/739955877/rendition/240p/file.mp4?loc=external&oauth2_token_id=1223210874&signature=31eb1f040dc468e2d733fd32cf84ec5bdaad2895b3fcf25967af52daf6cb5f30" type="video/mp4"
poster="https://pikwizard.com/pw/medium/6df5eefc3693aa69d4263d509b50ccf5.jpg"/>
Your browser does not support the video tag.
</video>
<p style="font-size: 12px; margin: 0;">PikWizard</p>
</a>
</span>
</span>
Free (free of charge)
Free for personal and commercial use.
Author: Awesome Content