
- Home >
- Stock Videos >
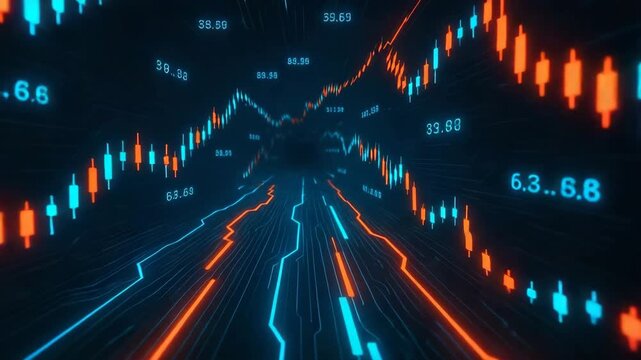
- Futuristic Stock Market Data Visualization with Graphs and Buildings
Futuristic Stock Market Data Visualization with Graphs and Buildings Video
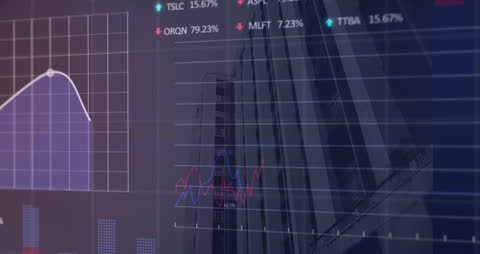
This video depicts animated graphs and data related to financial markets overlaying tall buildings, signaling a high-tech and forward-looking perspective on global economics. Useful for articles, presentations, or websites focused on stock market analysis, financial technology, corporate growth strategies, or urban economic studies.
Powered by 


2
downloads
downloads
Tags:
More
Credit Photo
If you would like to credit the Photo, here are some ways you can do so
Text Link
video Link
<span class="text-link">
<span>
<a target="_blank" href=https://pikwizard.com/video/futuristic-stock-market-data-visualization-with-graphs-and-buildings/f5e47b2b8320c7882df24b13b8181965/>PikWizard</a>
</span>
</span>
<span class="image-link">
<span
style="margin: 0 0 20px 0; display: inline-block; vertical-align: middle; width: 100%;"
>
<a
target="_blank"
href="https://pikwizard.com/video/futuristic-stock-market-data-visualization-with-graphs-and-buildings/f5e47b2b8320c7882df24b13b8181965/"
style="text-decoration: none; font-size: 10px; margin: 0;"
>
<video controls style="width: 100%; margin: 0;">
<source src="https://player.vimeo.com/progressive_redirect/playback/872239595/rendition/240p/file.mp4?loc=external&oauth2_token_id=1223210874&signature=da19600920d901f2d71b7c534aa4c23ab8304cc4c871059eda8f1f92621b76d9" type="video/mp4"
poster="https://pikwizard.com/pw/medium/f5e47b2b8320c7882df24b13b8181965.jpg"/>
Your browser does not support the video tag.
</video>
<p style="font-size: 12px; margin: 0;">PikWizard</p>
</a>
</span>
</span>
Free (free of charge)
Free for personal and commercial use.
Author: Awesome Content