
- Home >
- Free Stock Videos >
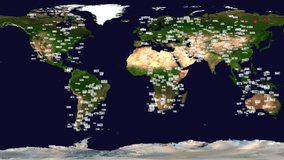
- Global Business Data Visualization in Digital Interface
Global Business Data Visualization in Digital Interface Free Stock Video

Colorful display combining a world map and data graphics illustrates global connections in business and technology sectors. Ideal for use in presentations on global economics, business innovations, or academic courses on finance. Suitable for websites and content related to data processing, international business strategies, or technology advancements.
Powered by  - Get 15% off with code: PIKWIZARD15


downloads
Tags:
More
Credit Photo
If you would like to credit the Photo, here are some ways you can do so
Text Link
video Link
<span class="text-link">
<span>
<a target="_blank" href=https://pikwizard.com/video/global-business-data-visualization-in-digital-interface/66526f474af13a433c3d86c873861e6b/>PikWizard</a>
</span>
</span>
<span class="image-link">
<span
style="margin: 0 0 20px 0; display: inline-block; vertical-align: middle; width: 100%;"
>
<a
target="_blank"
href="https://pikwizard.com/video/global-business-data-visualization-in-digital-interface/66526f474af13a433c3d86c873861e6b/"
style="text-decoration: none; font-size: 10px; margin: 0;"
>
<video controls style="width: 100%; margin: 0;">
<source src="https://player.vimeo.com/progressive_redirect/playback/717522366/rendition/240p/file.mp4?loc=external&oauth2_token_id=1223210874&signature=39e6b3bbf4465f2d2818783af211750e23d5038ba628cae80ac1dff90de8a2e0" type="video/mp4"
poster="https://thumbs.wbm.im/pw/medium/66526f474af13a433c3d86c873861e6b.jpg"/>
Your browser does not support the video tag.
</video>
<p style="font-size: 12px; margin: 0;">PikWizard</p>
</a>
</span>
</span>
Free (free of charge)
Free for personal and commercial use.
Author: Awesome Content