
- Home >
- Stock Videos >
- Global COVID-19 Impact with Data and Analytics Overlay
Global COVID-19 Impact with Data and Analytics Overlay Video

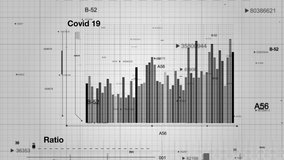
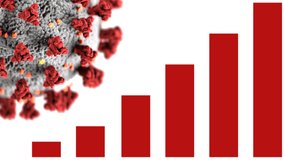
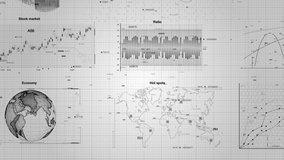
Visualizing impact of COVID-19 through data analytics globally. Suitable for use in presentations about pandemic effects on different regions. Helpful in articles explaining statistical trends and health data during the pandemic.
Powered by  - Get 15% off with code: PIKWIZARD15


downloads
Tags:
More
Credit Photo
If you would like to credit the Photo, here are some ways you can do so
Text Link
video Link
<span class="text-link">
<span>
<a target="_blank" href=https://pikwizard.com/video/global-covid-19-impact-with-data-and-analytics-overlay/b4b0916223e042014c0a2e13c4ecbc0d/>PikWizard</a>
</span>
</span>
<span class="image-link">
<span
style="margin: 0 0 20px 0; display: inline-block; vertical-align: middle; width: 100%;"
>
<a
target="_blank"
href="https://pikwizard.com/video/global-covid-19-impact-with-data-and-analytics-overlay/b4b0916223e042014c0a2e13c4ecbc0d/"
style="text-decoration: none; font-size: 10px; margin: 0;"
>
<video controls style="width: 100%; margin: 0;">
<source src="https://player.vimeo.com/progressive_redirect/playback/771337317/rendition/240p/file.mp4?loc=external&oauth2_token_id=1223210874&signature=b4d723b39dcf490aabd2def4a023e68d77d992eec40b292a3977863fbea8caf2" type="video/mp4"
poster="https://pikwizard.com/pw/medium/b4b0916223e042014c0a2e13c4ecbc0d.jpg"/>
Your browser does not support the video tag.
</video>
<p style="font-size: 12px; margin: 0;">PikWizard</p>
</a>
</span>
</span>
Free (free of charge)
Free for personal and commercial use.
Author: Awesome Content