
- Home >
- Stock Videos >
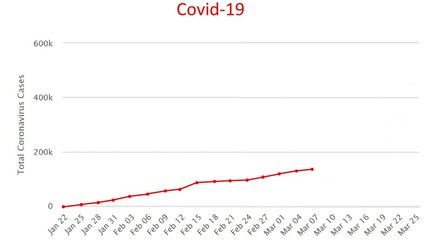
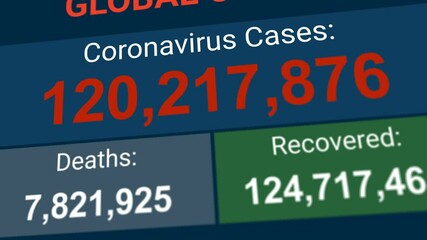
- Global COVID-19 Pandemic Data and Analytics Visualization
Global COVID-19 Pandemic Data and Analytics Visualization Video

Visual representation showcasing the global impact of COVID-19 with data charts and analytics. Ideal for presentations about the pandemic, healthcare industry updates, and technology applications in crisis management. Useful for conveying statistical information and its effects on the global economy and public health.
Powered by 


downloads
Tags:
More
Credit Photo
If you would like to credit the Photo, here are some ways you can do so
Text Link
video Link
<span class="text-link">
<span>
<a target="_blank" href=https://pikwizard.com/video/global-covid-19-pandemic-data-and-analytics-visualization/fb97ea25f950b6ebf696ad1913c537aa/>PikWizard</a>
</span>
</span>
<span class="image-link">
<span
style="margin: 0 0 20px 0; display: inline-block; vertical-align: middle; width: 100%;"
>
<a
target="_blank"
href="https://pikwizard.com/video/global-covid-19-pandemic-data-and-analytics-visualization/fb97ea25f950b6ebf696ad1913c537aa/"
style="text-decoration: none; font-size: 10px; margin: 0;"
>
<video controls style="width: 100%; margin: 0;">
<source src="https://player.vimeo.com/progressive_redirect/playback/718221199/rendition/240p/file.mp4?loc=external&oauth2_token_id=1223210874&signature=5497ee00ccbb749e58ec9532c5cd15d8db3baa2478c1f7eff8c6f531260e0f75" type="video/mp4"
poster="https://pikwizard.com/pw/medium/fb97ea25f950b6ebf696ad1913c537aa.jpg"/>
Your browser does not support the video tag.
</video>
<p style="font-size: 12px; margin: 0;">PikWizard</p>
</a>
</span>
</span>
Free (free of charge)
Free for personal and commercial use.
Author: Awesome Content