
- Home >
- Stock Videos >
- Global Data Analysis Highlighted on World Map with Cyber Interface
Global Data Analysis Highlighted on World Map with Cyber Interface Video
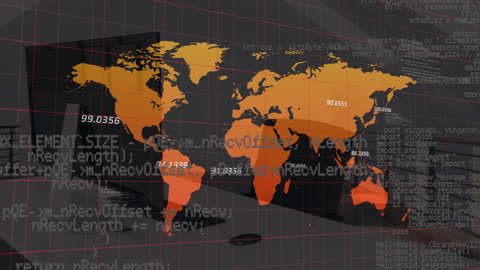
Visual depicts global data interconnectedness featuring a cyber-themed interface overlay on a world map. Numbers and code fragments symbolize data analytics, offering insights into global trends and information technology. Ideal for illustrating topics related to data sciences, globalization of technology, pandemic analytics, and international statistics.
Powered by 


downloads
Tags:
More
Credit Photo
If you would like to credit the Photo, here are some ways you can do so
Text Link
video Link
<span class="text-link">
<span>
<a target="_blank" href=https://pikwizard.com/video/global-data-analysis-highlighted-on-world-map-with-cyber-interface/8b5a4925f50089f8b9408bc31377457c/>PikWizard</a>
</span>
</span>
<span class="image-link">
<span
style="margin: 0 0 20px 0; display: inline-block; vertical-align: middle; width: 100%;"
>
<a
target="_blank"
href="https://pikwizard.com/video/global-data-analysis-highlighted-on-world-map-with-cyber-interface/8b5a4925f50089f8b9408bc31377457c/"
style="text-decoration: none; font-size: 10px; margin: 0;"
>
<video controls style="width: 100%; margin: 0;">
<source src="https://player.vimeo.com/progressive_redirect/playback/758872410/rendition/240p/file.mp4?loc=external&oauth2_token_id=1223210874&signature=97a24cbbeccd9c78d35aa3a0917965bb7f0c1ca56e8c25517d489fa429e97233" type="video/mp4"
poster="https://pikwizard.com/pw/medium/8b5a4925f50089f8b9408bc31377457c.jpg"/>
Your browser does not support the video tag.
</video>
<p style="font-size: 12px; margin: 0;">PikWizard</p>
</a>
</span>
</span>
Free (free of charge)
Free for personal and commercial use.
Author: Awesome Content