
- Home >
- Stock Videos >
- Global Data Analysis with Overlapping Spinning Earth and Bar Graph
Global Data Analysis with Overlapping Spinning Earth and Bar Graph Video
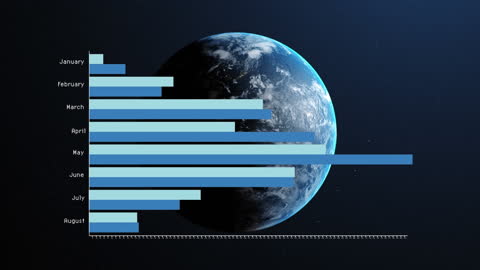
Visualization overlaying global data represented through a changing bar graph and a rotating planet Earth, illustrating themes of worldwide connectivity, technological progress, and market trends. Ideal for presentations on international business statistics, infographics about global networks, or tech blogs highlighting digital analytics and data handling.

downloads
Tags:
More
Credit Photo
If you would like to credit the Photo, here are some ways you can do so
Text Link
video Link
<span class="text-link">
<span>
<a target="_blank" href=https://pikwizard.com/video/global-data-analysis-with-overlapping-spinning-earth-and-bar-graph/1f20f775e7c6580a5b64b710ff2de839/>PikWizard</a>
</span>
</span>
<span class="image-link">
<span
style="margin: 0 0 20px 0; display: inline-block; vertical-align: middle; width: 100%;"
>
<a
target="_blank"
href="https://pikwizard.com/video/global-data-analysis-with-overlapping-spinning-earth-and-bar-graph/1f20f775e7c6580a5b64b710ff2de839/"
style="text-decoration: none; font-size: 10px; margin: 0;"
>
<video controls style="width: 100%; margin: 0;">
<source src="https://player.vimeo.com/progressive_redirect/playback/735078089/rendition/240p/file.mp4?loc=external&oauth2_token_id=1223210874&signature=3ff1b9b09d4bb99c65d8b43786922440b7e28366791e5bfe3545f0bd7c1fc288" type="video/mp4"
poster="https://pikwizard.com/pw/medium/1f20f775e7c6580a5b64b710ff2de839.jpg"/>
Your browser does not support the video tag.
</video>
<p style="font-size: 12px; margin: 0;">PikWizard</p>
</a>
</span>
</span>
Free (free of charge)
Free for personal and commercial use.
Author: Awesome Content