
- Home >
- Stock Videos >
- Global Data Analysis with World Map and Bar Graph
Global Data Analysis with World Map and Bar Graph Video
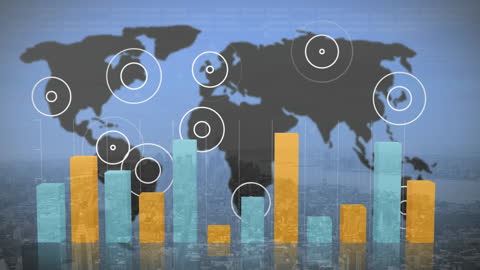
Visual representation of global data with bar graphs overlaying a world map and cityscape. Useful for presentations on economics, finance trends, and technological advancements. Suitable for illustrating global communication and artificial intelligence applications in data analysis.
Powered by 


downloads
Tags:
More
Credit Photo
If you would like to credit the Photo, here are some ways you can do so
Text Link
video Link
<span class="text-link">
<span>
<a target="_blank" href=https://pikwizard.com/video/global-data-analysis-with-world-map-and-bar-graph/39b1482f59bcd79cc724193520a26ea4/>PikWizard</a>
</span>
</span>
<span class="image-link">
<span
style="margin: 0 0 20px 0; display: inline-block; vertical-align: middle; width: 100%;"
>
<a
target="_blank"
href="https://pikwizard.com/video/global-data-analysis-with-world-map-and-bar-graph/39b1482f59bcd79cc724193520a26ea4/"
style="text-decoration: none; font-size: 10px; margin: 0;"
>
<video controls style="width: 100%; margin: 0;">
<source src="https://player.vimeo.com/progressive_redirect/playback/743838090/rendition/240p/file.mp4?loc=external&oauth2_token_id=1223210874&signature=0331b333694820775ca5b0bb3b49b42e1600da19177cecd0b95f676cedd0d4cd" type="video/mp4"
poster="https://pikwizard.com/pw/medium/39b1482f59bcd79cc724193520a26ea4.jpg"/>
Your browser does not support the video tag.
</video>
<p style="font-size: 12px; margin: 0;">PikWizard</p>
</a>
</span>
</span>
Free (free of charge)
Free for personal and commercial use.
Author: Awesome Content