
- Home >
- Stock Videos >
- Global Data Analytics Visualization over Earth with Charts
Global Data Analytics Visualization over Earth with Charts Video
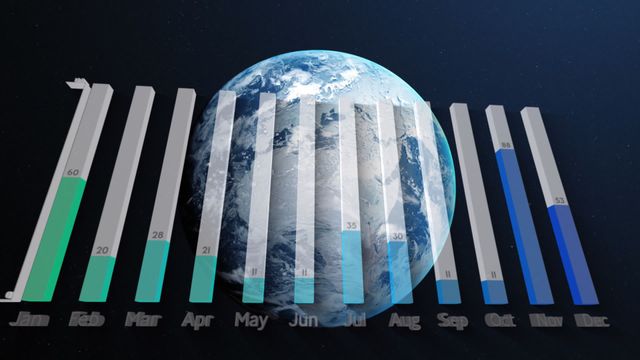
Interactive display showcasing global business data analytics. Earth serves as a dynamic backdrop to month-by-month data trends, represented through vibrant vertical and horizontal charts. Suitable for business presentations, environmental reports, and technology showcases with a focus on data analysis trends across the year.
Powered by 


downloads
Tags:
More
Credit Photo
If you would like to credit the Photo, here are some ways you can do so
Text Link
video Link
<span class="text-link">
<span>
<a target="_blank" href=https://pikwizard.com/video/global-data-analytics-visualization-over-earth-with-charts/fcf3a3d88a57b9c50c1ea0b592cf1c28/>PikWizard</a>
</span>
</span>
<span class="image-link">
<span
style="margin: 0 0 20px 0; display: inline-block; vertical-align: middle; width: 100%;"
>
<a
target="_blank"
href="https://pikwizard.com/video/global-data-analytics-visualization-over-earth-with-charts/fcf3a3d88a57b9c50c1ea0b592cf1c28/"
style="text-decoration: none; font-size: 10px; margin: 0;"
>
<video controls style="width: 100%; margin: 0;">
<source src="https://player.vimeo.com/progressive_redirect/playback/759666512/rendition/240p/file.mp4?loc=external&oauth2_token_id=1223210874&signature=ebcee57ad89c7fb2f4e62098342d67fb535e5a0cbad8e40f9113884e36a1fab5" type="video/mp4"
poster="https://pikwizard.com/pw/medium/fcf3a3d88a57b9c50c1ea0b592cf1c28.jpg"/>
Your browser does not support the video tag.
</video>
<p style="font-size: 12px; margin: 0;">PikWizard</p>
</a>
</span>
</span>
Free (free of charge)
Free for personal and commercial use.
Author: Awesome Content