
- Home >
- Stock Videos >
- Global Data and Statistics Visualization with Graphs
Global Data and Statistics Visualization with Graphs Video
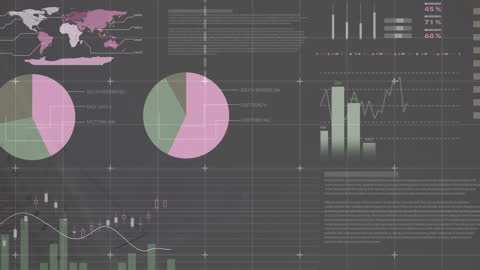
Modern animation showcases diverse statistical elements such as pie charts, bar graphs, and digital readings, perfect for presentations, reports, and projects related to data analytics, global business trends, and technological advancements.

downloads
Tags:
More
Credit Photo
If you would like to credit the Photo, here are some ways you can do so
Text Link
video Link
<span class="text-link">
<span>
<a target="_blank" href=https://pikwizard.com/video/global-data-and-statistics-visualization-with-graphs/14c890996a093f6a4ae379fecd90dae0/>PikWizard</a>
</span>
</span>
<span class="image-link">
<span
style="margin: 0 0 20px 0; display: inline-block; vertical-align: middle; width: 100%;"
>
<a
target="_blank"
href="https://pikwizard.com/video/global-data-and-statistics-visualization-with-graphs/14c890996a093f6a4ae379fecd90dae0/"
style="text-decoration: none; font-size: 10px; margin: 0;"
>
<video controls style="width: 100%; margin: 0;">
<source src="https://player.vimeo.com/progressive_redirect/playback/742102271/rendition/240p/file.mp4?loc=external&oauth2_token_id=1223210874&signature=8d27627832f1399c81b6bef0acc4fa928cc0efa493d378ad82104a9f77385073" type="video/mp4"
poster="https://pikwizard.com/pw/medium/14c890996a093f6a4ae379fecd90dae0.jpg"/>
Your browser does not support the video tag.
</video>
<p style="font-size: 12px; margin: 0;">PikWizard</p>
</a>
</span>
</span>
Free (free of charge)
Free for personal and commercial use.
Author: Awesome Content