
- Home >
- Stock Videos >
- Global Data Processing Animation with Charts and Graphs
Global Data Processing Animation with Charts and Graphs Video
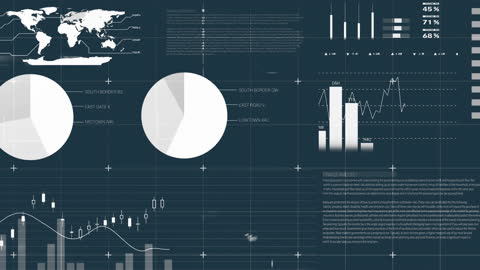
This animated scene showcases complex digital data visualization with charts, graphs, and a world map overlay on a dark background. It is ideal for illustrating concepts related to global data processing, analytics, financial reporting, and big data applications. Suitable for use in videos, presentations, websites, and marketing materials to enhance tech-focused content.
Powered by  - Get 15% off with code: PIKWIZARD15


downloads
Tags:
More
Credit Photo
If you would like to credit the Photo, here are some ways you can do so
Text Link
video Link
<span class="text-link">
<span>
<a target="_blank" href=https://pikwizard.com/video/global-data-processing-animation-with-charts-and-graphs/4e6d2fe55729ae0b1c0d12896573a1a4/>PikWizard</a>
</span>
</span>
<span class="image-link">
<span
style="margin: 0 0 20px 0; display: inline-block; vertical-align: middle; width: 100%;"
>
<a
target="_blank"
href="https://pikwizard.com/video/global-data-processing-animation-with-charts-and-graphs/4e6d2fe55729ae0b1c0d12896573a1a4/"
style="text-decoration: none; font-size: 10px; margin: 0;"
>
<video controls style="width: 100%; margin: 0;">
<source src="https://player.vimeo.com/progressive_redirect/playback/758867400/rendition/240p/file.mp4?loc=external&oauth2_token_id=1223210874&signature=78011a252eef33c7113fe7cb8ea57df9fea18e0d6c43fecfe6bb5113879f0aa9" type="video/mp4"
poster="https://pikwizard.com/pw/medium/4e6d2fe55729ae0b1c0d12896573a1a4.jpg"/>
Your browser does not support the video tag.
</video>
<p style="font-size: 12px; margin: 0;">PikWizard</p>
</a>
</span>
</span>
Free (free of charge)
Free for personal and commercial use.
Author: Awesome Content