
- Home >
- Stock Videos >
- Global Data Processing Over World Map Animation
Global Data Processing Over World Map Animation Video
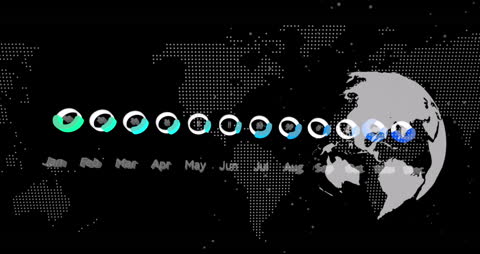
Digital animation features monthly data visualization across global map background. Circles represent information processing each month, highlighting concept of ongoing data analysis and finance tracking throughout the year. Suitable for presentations, educational materials, and reports on corporate activities and statistical data communication worldwide.

downloads
Tags:
More
Credit Photo
If you would like to credit the Photo, here are some ways you can do so
Text Link
video Link
<span class="text-link">
<span>
<a target="_blank" href=https://pikwizard.com/video/global-data-processing-over-world-map-animation/8e3f8fe97a886f565a652970c99603ab/>PikWizard</a>
</span>
</span>
<span class="image-link">
<span
style="margin: 0 0 20px 0; display: inline-block; vertical-align: middle; width: 100%;"
>
<a
target="_blank"
href="https://pikwizard.com/video/global-data-processing-over-world-map-animation/8e3f8fe97a886f565a652970c99603ab/"
style="text-decoration: none; font-size: 10px; margin: 0;"
>
<video controls style="width: 100%; margin: 0;">
<source src="https://player.vimeo.com/progressive_redirect/playback/735847315/rendition/240p/file.mp4?loc=external&oauth2_token_id=1223210874&signature=ddb3760758ad3248bc3ad722e6ca42de4ff9b7527264b7a073d76d0da41e6553" type="video/mp4"
poster="https://pikwizard.com/pw/medium/8e3f8fe97a886f565a652970c99603ab.jpg"/>
Your browser does not support the video tag.
</video>
<p style="font-size: 12px; margin: 0;">PikWizard</p>
</a>
</span>
</span>
Free (free of charge)
Free for personal and commercial use.
Author: Awesome Content