
- Home >
- Stock Videos >
- Global Data Visualization with Colorful Metric Circles
Global Data Visualization with Colorful Metric Circles Video
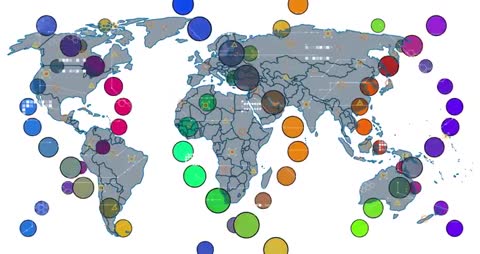
A world map adorned with various vibrant circles illustrating global data metrics, emphasizing different regions. This serves as an ideal representation for presentations focused on data-driven technologies, international analytics, or tech-savvy initiatives. Use in tech blogs, corporate dashboards, or educational content to enhance visual engagement and clarify complex data insights.
Powered by 


0
downloads
downloads
Tags:
More
Credit Photo
If you would like to credit the Photo, here are some ways you can do so
Text Link
video Link
<span class="text-link">
<span>
<a target="_blank" href=https://pikwizard.com/video/global-data-visualization-with-colorful-metric-circles/fe425d1c6ab4c510a462d3867a1c6058/>PikWizard</a>
</span>
</span>
<span class="image-link">
<span
style="margin: 0 0 20px 0; display: inline-block; vertical-align: middle; width: 100%;"
>
<a
target="_blank"
href="https://pikwizard.com/video/global-data-visualization-with-colorful-metric-circles/fe425d1c6ab4c510a462d3867a1c6058/"
style="text-decoration: none; font-size: 10px; margin: 0;"
>
<video controls style="width: 100%; margin: 0;">
<source src="https://player.vimeo.com/progressive_redirect/playback/1090384604/rendition/240p/file.mp4?loc=external&oauth2_token_id=1223210874&signature=4140ef3966bb6e745a523a20e5b572f355ae8dbdc7263a481c5a5516323eb156" type="video/mp4"
poster="https://pikwizard.com/pw/medium/fe425d1c6ab4c510a462d3867a1c6058.jpg"/>
Your browser does not support the video tag.
</video>
<p style="font-size: 12px; margin: 0;">PikWizard</p>
</a>
</span>
</span>
Free (free of charge)
Free for personal and commercial use.
Author: Awesome Content