
- Home >
- Stock Videos >
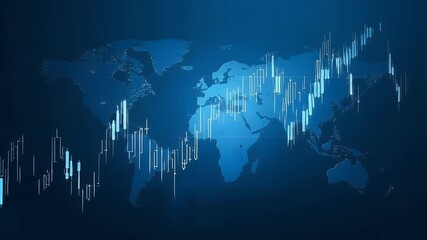
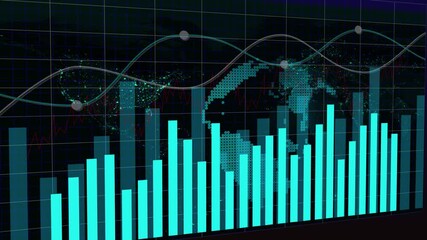
- Global Economy and Financial Analysis Interface with World Map
Global Economy and Financial Analysis Interface with World Map Video
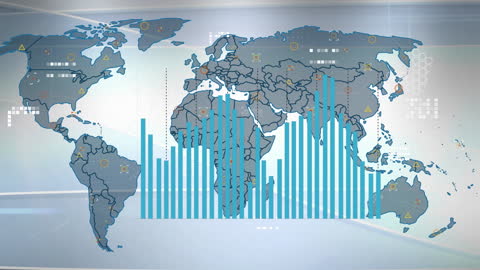
Creative blend of data and visual elements depicting global financial themes. World map is combined with animated bar graphs and digital icons to represent connectivity and diverse financial factors. Ideal for illustrating concepts related to global business networks, economic analysis, international finance trends, and digital technologies in corporate presentations or financial reports.
Powered by 


1
downloads
downloads
Tags:
More
Credit Photo
If you would like to credit the Photo, here are some ways you can do so
Text Link
video Link
<span class="text-link">
<span>
<a target="_blank" href=https://pikwizard.com/video/global-economy-and-financial-analysis-interface-with-world-map/e63e42451b2c09d7eee9be269980eb48/>PikWizard</a>
</span>
</span>
<span class="image-link">
<span
style="margin: 0 0 20px 0; display: inline-block; vertical-align: middle; width: 100%;"
>
<a
target="_blank"
href="https://pikwizard.com/video/global-economy-and-financial-analysis-interface-with-world-map/e63e42451b2c09d7eee9be269980eb48/"
style="text-decoration: none; font-size: 10px; margin: 0;"
>
<video controls style="width: 100%; margin: 0;">
<source src="https://player.vimeo.com/progressive_redirect/playback/735838498/rendition/240p/file.mp4?loc=external&oauth2_token_id=1223210874&signature=b56c36b9420a997d85d4de2b2ae00fe4985793394409fdc50501332b40d1d45a" type="video/mp4"
poster="https://pikwizard.com/pw/medium/e63e42451b2c09d7eee9be269980eb48.jpg"/>
Your browser does not support the video tag.
</video>
<p style="font-size: 12px; margin: 0;">PikWizard</p>
</a>
</span>
</span>
Free (free of charge)
Free for personal and commercial use.
Author: Awesome Content