
- Home >
- Stock Videos >
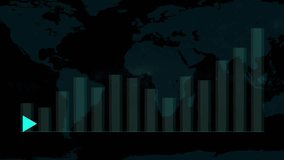
- Global Finance Data with Rising Graphs and Digital Interface
Global Finance Data with Rising Graphs and Digital Interface Video

Displays animated financial statistics alongside fluctuating line graphs overlaying a rotating globe. Useful for illustrating global market trends, economic analysis, finance courses, and digital marketing presentations focusing on the business world.
Powered by  - Get 15% off with code: PIKWIZARD15


downloads
Tags:
More
Credit Photo
If you would like to credit the Photo, here are some ways you can do so
Text Link
video Link
<span class="text-link">
<span>
<a target="_blank" href=https://pikwizard.com/video/global-finance-data-with-rising-graphs-and-digital-interface/f6d1f0d69075125fb54b699e8a61017b/>PikWizard</a>
</span>
</span>
<span class="image-link">
<span
style="margin: 0 0 20px 0; display: inline-block; vertical-align: middle; width: 100%;"
>
<a
target="_blank"
href="https://pikwizard.com/video/global-finance-data-with-rising-graphs-and-digital-interface/f6d1f0d69075125fb54b699e8a61017b/"
style="text-decoration: none; font-size: 10px; margin: 0;"
>
<video controls style="width: 100%; margin: 0;">
<source src="https://player.vimeo.com/progressive_redirect/playback/715868907/rendition/360p/file.mp4?loc=external&oauth2_token_id=1223210874&signature=15ec528a160a313cb07f391f0a5f56bad3bce6cf4c32efae13f24e0cc71fc5c0" type="video/mp4"
poster="https://pikwizard.com/pw/medium/f6d1f0d69075125fb54b699e8a61017b.jpg"/>
Your browser does not support the video tag.
</video>
<p style="font-size: 12px; margin: 0;">PikWizard</p>
</a>
</span>
</span>
Free (free of charge)
Free for personal and commercial use.
Author: Awesome Content