
- Home >
- Stock Videos >
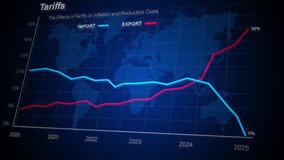
- Global Financial Analysis Concept with Arrows on World Map
Global Financial Analysis Concept with Arrows on World Map Video

Abstract animation illustrating global financial analysis. Features overlaid arrows on a world map and financial data. Ideal for representing global economic trends, digital finance platforms, or business intelligence presentations.
Powered by  - Get 15% off with code: PIKWIZARD15


3
downloads
downloads
Tags:
More
Credit Photo
If you would like to credit the Photo, here are some ways you can do so
Text Link
video Link
<span class="text-link">
<span>
<a target="_blank" href=https://pikwizard.com/video/global-financial-analysis-concept-with-arrows-on-world-map/07a1b9d7a5f0d8c061e1797bc4d3fe8b/>PikWizard</a>
</span>
</span>
<span class="image-link">
<span
style="margin: 0 0 20px 0; display: inline-block; vertical-align: middle; width: 100%;"
>
<a
target="_blank"
href="https://pikwizard.com/video/global-financial-analysis-concept-with-arrows-on-world-map/07a1b9d7a5f0d8c061e1797bc4d3fe8b/"
style="text-decoration: none; font-size: 10px; margin: 0;"
>
<video controls style="width: 100%; margin: 0;">
<source src="https://player.vimeo.com/progressive_redirect/playback/771089135/rendition/240p/file.mp4?loc=external&oauth2_token_id=1223210874&signature=14c84a082dd95615c606e0940d7f49734093e3fbefab72e9ac0600ffb11d1224" type="video/mp4"
poster="https://pikwizard.com/pw/medium/07a1b9d7a5f0d8c061e1797bc4d3fe8b.jpg"/>
Your browser does not support the video tag.
</video>
<p style="font-size: 12px; margin: 0;">PikWizard</p>
</a>
</span>
</span>
Free (free of charge)
Free for personal and commercial use.
Author: Awesome Content