
- Home >
- Stock Videos >
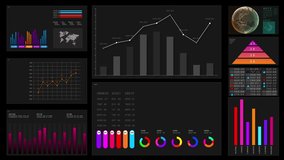
- Global Financial Analytics Concept with Arrows and Charts
Global Financial Analytics Concept with Arrows and Charts Video

This visual represents a conceptual blend of global business and finance, featuring various charts and arrows typically found in financial or stock market analysis. Great for use in presentations on finance, business strategy, economic trends, or any technological session discussing data processing, analysis, and global market movements.
Powered by  - Get 15% off with code: PIKWIZARD15


3
downloads
downloads
Tags:
More
Credit Photo
If you would like to credit the Photo, here are some ways you can do so
Text Link
video Link
<span class="text-link">
<span>
<a target="_blank" href=https://pikwizard.com/video/global-financial-analytics-concept-with-arrows-and-charts/1f432b791d80e52749d533b76e1d4452/>PikWizard</a>
</span>
</span>
<span class="image-link">
<span
style="margin: 0 0 20px 0; display: inline-block; vertical-align: middle; width: 100%;"
>
<a
target="_blank"
href="https://pikwizard.com/video/global-financial-analytics-concept-with-arrows-and-charts/1f432b791d80e52749d533b76e1d4452/"
style="text-decoration: none; font-size: 10px; margin: 0;"
>
<video controls style="width: 100%; margin: 0;">
<source src="https://player.vimeo.com/progressive_redirect/playback/717904661/rendition/360p/file.mp4?loc=external&oauth2_token_id=1223210874&signature=92c64e63d346f2425cddc6308f006e2fe687659d10e64f083a3447872480ffb7" type="video/mp4"
poster="https://pikwizard.com/pw/medium/1f432b791d80e52749d533b76e1d4452.jpg"/>
Your browser does not support the video tag.
</video>
<p style="font-size: 12px; margin: 0;">PikWizard</p>
</a>
</span>
</span>
Free (free of charge)
Free for personal and commercial use.
Author: Awesome Content