
- Home >
- Stock Videos >
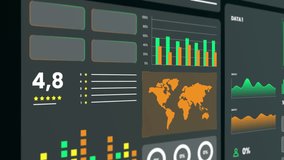
- Global Financial Analytics Digital Interface
Global Financial Analytics Digital Interface Video

Visualization presents a digital interface featuring financial analytics over a world map backdrop. Graphs and rising arrows symbolize economic growth, potentially useful in illustrating global economics, business reports or presentations centered around financial technology or data analysis.
Powered by  - Get 15% off with code: PIKWIZARD15


downloads
Tags:
More
Credit Photo
If you would like to credit the Photo, here are some ways you can do so
Text Link
video Link
<span class="text-link">
<span>
<a target="_blank" href=https://pikwizard.com/video/global-financial-analytics-digital-interface/dbfadeb2c06f72d6c61734b08c4d99a1/>PikWizard</a>
</span>
</span>
<span class="image-link">
<span
style="margin: 0 0 20px 0; display: inline-block; vertical-align: middle; width: 100%;"
>
<a
target="_blank"
href="https://pikwizard.com/video/global-financial-analytics-digital-interface/dbfadeb2c06f72d6c61734b08c4d99a1/"
style="text-decoration: none; font-size: 10px; margin: 0;"
>
<video controls style="width: 100%; margin: 0;">
<source src="https://player.vimeo.com/progressive_redirect/playback/756536766/rendition/240p/file.mp4?loc=external&oauth2_token_id=1223210874&signature=500028d77bb7b669ce19f920d3b20c8e341515a67af03d19f8bba2c0bc84db76" type="video/mp4"
poster="https://pikwizard.com/pw/medium/dbfadeb2c06f72d6c61734b08c4d99a1.jpg"/>
Your browser does not support the video tag.
</video>
<p style="font-size: 12px; margin: 0;">PikWizard</p>
</a>
</span>
</span>
Free (free of charge)
Free for personal and commercial use.
Author: Awesome Content