
- Home >
- Stock Videos >
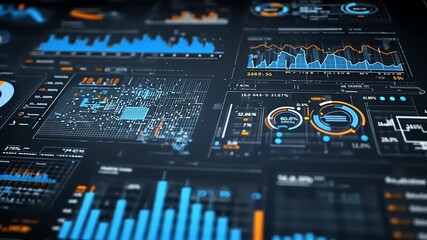
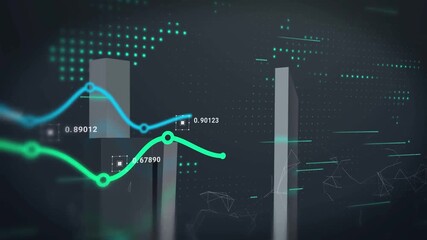
- Global Financial Data Analysis with Graphs and Digital Interfaces
Global Financial Data Analysis with Graphs and Digital Interfaces Video

Abstract conceptual design showing global financial systems interacting with data analytics and technology. Ideal for use in technology-related publications, business reports, finance presentations, and educational materials focused on global economics and digital transformation.
Powered by 


downloads
Tags:
More
Credit Photo
If you would like to credit the Photo, here are some ways you can do so
Text Link
video Link
<span class="text-link">
<span>
<a target="_blank" href=https://pikwizard.com/video/global-financial-data-analysis-with-graphs-and-digital-interfaces/500271fbcbc488f1dd0a304f070e6ffd/>PikWizard</a>
</span>
</span>
<span class="image-link">
<span
style="margin: 0 0 20px 0; display: inline-block; vertical-align: middle; width: 100%;"
>
<a
target="_blank"
href="https://pikwizard.com/video/global-financial-data-analysis-with-graphs-and-digital-interfaces/500271fbcbc488f1dd0a304f070e6ffd/"
style="text-decoration: none; font-size: 10px; margin: 0;"
>
<video controls style="width: 100%; margin: 0;">
<source src="https://player.vimeo.com/progressive_redirect/playback/736068513/rendition/240p/file.mp4?loc=external&oauth2_token_id=1223210874&signature=2cafea3266e25488a77f0fd7ea1f79707354ec7c7f266c453f89d3db94da805e" type="video/mp4"
poster="https://pikwizard.com/pw/medium/500271fbcbc488f1dd0a304f070e6ffd.jpg"/>
Your browser does not support the video tag.
</video>
<p style="font-size: 12px; margin: 0;">PikWizard</p>
</a>
</span>
</span>
Free (free of charge)
Free for personal and commercial use.
Author: Awesome Content