
- Home >
- Stock Videos >
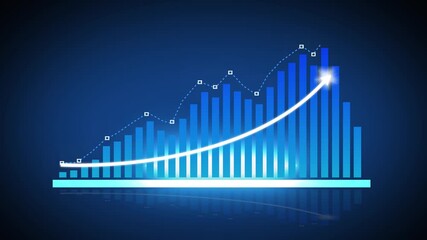
- Global Financial Data and Analysis with Statistical Graphs
Global Financial Data and Analysis with Statistical Graphs Video

Illustrating complex financial analytics and global stats, this video can enhance presentations about worldwide economic trends, finance workshops, and business strategy sessions. Graphics represent real-time data processing with implications for stock market, financial services, and business intelligence applications.
Powered by 


downloads
Tags:
More
Credit Photo
If you would like to credit the Photo, here are some ways you can do so
Text Link
video Link
<span class="text-link">
<span>
<a target="_blank" href=https://pikwizard.com/video/global-financial-data-and-analysis-with-statistical-graphs/7409de17ab67599e44199de90ba9530e/>PikWizard</a>
</span>
</span>
<span class="image-link">
<span
style="margin: 0 0 20px 0; display: inline-block; vertical-align: middle; width: 100%;"
>
<a
target="_blank"
href="https://pikwizard.com/video/global-financial-data-and-analysis-with-statistical-graphs/7409de17ab67599e44199de90ba9530e/"
style="text-decoration: none; font-size: 10px; margin: 0;"
>
<video controls style="width: 100%; margin: 0;">
<source src="https://player.vimeo.com/progressive_redirect/playback/905685008/rendition/240p/file.mp4?loc=external&oauth2_token_id=1223210874&signature=1493bd074d0468ccbc11a9da4b3213429112925a1b84da13b669187e9f1c0844" type="video/mp4"
poster="https://pikwizard.com/pw/medium/7409de17ab67599e44199de90ba9530e.jpg"/>
Your browser does not support the video tag.
</video>
<p style="font-size: 12px; margin: 0;">PikWizard</p>
</a>
</span>
</span>
Free (free of charge)
Free for personal and commercial use.
Author: Awesome Content