
- Home >
- Stock Videos >
- Global Financial Data and Analytics Interface Conceptual Visualization
Global Financial Data and Analytics Interface Conceptual Visualization Video
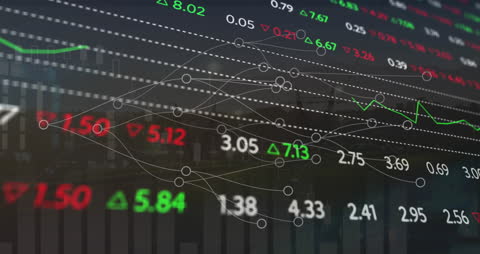
The visual combines elements of finance and technology, showcasing analytical data interfaces and stock market trends. This representation suits uses in business presentations, economic seminars, and educational material on financial markets and digital transformation. It can also enhance website backdrops for fintech companies and financial service marketing.

downloads
Tags:
More
Credit Photo
If you would like to credit the Photo, here are some ways you can do so
Text Link
video Link
<span class="text-link">
<span>
<a target="_blank" href=https://pikwizard.com/video/global-financial-data-and-analytics-interface-conceptual-visualization/28be1843538d085356903848cb04169b/>PikWizard</a>
</span>
</span>
<span class="image-link">
<span
style="margin: 0 0 20px 0; display: inline-block; vertical-align: middle; width: 100%;"
>
<a
target="_blank"
href="https://pikwizard.com/video/global-financial-data-and-analytics-interface-conceptual-visualization/28be1843538d085356903848cb04169b/"
style="text-decoration: none; font-size: 10px; margin: 0;"
>
<video controls style="width: 100%; margin: 0;">
<source src="https://player.vimeo.com/progressive_redirect/playback/911375477/rendition/240p/file.mp4?loc=external&oauth2_token_id=1223210874&signature=1a24b85d3db71d6173a3856f2584bb8b2d39ab2c234eb8a0d503a5cb2c76e6b8" type="video/mp4"
poster="https://pikwizard.com/pw/medium/28be1843538d085356903848cb04169b.jpg"/>
Your browser does not support the video tag.
</video>
<p style="font-size: 12px; margin: 0;">PikWizard</p>
</a>
</span>
</span>
Free (free of charge)
Free for personal and commercial use.
Author: Awesome Content