
- Home >
- Stock Videos >
- Global Financial Data Map and Analytics Visualization
Global Financial Data Map and Analytics Visualization Video
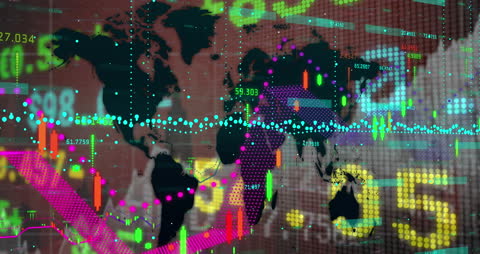
Visualization combines world map with layered financial data such as graphs and numeric analytics, representing the interconnectedness of global finance and economy. Useful for presentations in financial analysis, economic forecasts, corporate messaging, or technology growth. Emphasizes progress in digital and technological integration in modern financial systems.
Powered by 


downloads
Tags:
More
Credit Photo
If you would like to credit the Photo, here are some ways you can do so
Text Link
video Link
<span class="text-link">
<span>
<a target="_blank" href=https://pikwizard.com/video/global-financial-data-map-and-analytics-visualization/83803938fba4980826a9e23487f9ed68/>PikWizard</a>
</span>
</span>
<span class="image-link">
<span
style="margin: 0 0 20px 0; display: inline-block; vertical-align: middle; width: 100%;"
>
<a
target="_blank"
href="https://pikwizard.com/video/global-financial-data-map-and-analytics-visualization/83803938fba4980826a9e23487f9ed68/"
style="text-decoration: none; font-size: 10px; margin: 0;"
>
<video controls style="width: 100%; margin: 0;">
<source src="https://player.vimeo.com/progressive_redirect/playback/746263415/rendition/240p/file.mp4?loc=external&oauth2_token_id=1223210874&signature=0a4d22975f18186c0ae3d0b7c685edcd36a9a2a71b071b6497b9b63f7c7b28ac" type="video/mp4"
poster="https://pikwizard.com/pw/medium/83803938fba4980826a9e23487f9ed68.jpg"/>
Your browser does not support the video tag.
</video>
<p style="font-size: 12px; margin: 0;">PikWizard</p>
</a>
</span>
</span>
Free (free of charge)
Free for personal and commercial use.
Author: Awesome Content