
- Home >
- Stock Videos >
- Global Financial Data Networking and Analytics Concept
Global Financial Data Networking and Analytics Concept Video
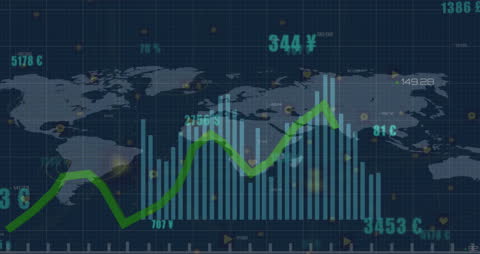
Visualizing trend lines and bar graphs over a world map signifies global finance themes. Useful for presentations on financial analytics, global markets, and technology integration in economics. Ideal for illustrating complex data science projects and discussions around worldwide economic impact.

downloads
Tags:
More
Credit Photo
If you would like to credit the Photo, here are some ways you can do so
Text Link
video Link
<span class="text-link">
<span>
<a target="_blank" href=https://pikwizard.com/video/global-financial-data-networking-and-analytics-concept/62154ebbf564b1213be781605170f493/>PikWizard</a>
</span>
</span>
<span class="image-link">
<span
style="margin: 0 0 20px 0; display: inline-block; vertical-align: middle; width: 100%;"
>
<a
target="_blank"
href="https://pikwizard.com/video/global-financial-data-networking-and-analytics-concept/62154ebbf564b1213be781605170f493/"
style="text-decoration: none; font-size: 10px; margin: 0;"
>
<video controls style="width: 100%; margin: 0;">
<source src="https://player.vimeo.com/progressive_redirect/playback/790520374/rendition/240p/file.mp4?loc=external&oauth2_token_id=1223210874&signature=6c26bbef6d86756ad268d1bc59d1ba46952d2b128e1e64a22a550c72d02e3269" type="video/mp4"
poster="https://pikwizard.com/pw/medium/62154ebbf564b1213be781605170f493.jpg"/>
Your browser does not support the video tag.
</video>
<p style="font-size: 12px; margin: 0;">PikWizard</p>
</a>
</span>
</span>
Free (free of charge)
Free for personal and commercial use.
Author: Awesome Content