
- Home >
- Stock Videos >
- Global Financial Data on Digital World Map Display
Global Financial Data on Digital World Map Display Video
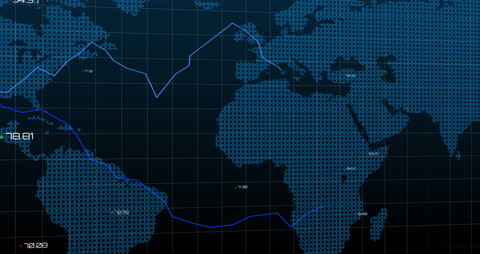
Visualization of global financial data shown on a digital world map interface. This complex graphic represents financial trends and statistics with interconnected lines and numerous data projections. Perfect for use in presentations or articles related to international finance, investment analysis, stock market trends, economics education, or technology-driven insights into global markets.
Powered by 


downloads
Tags:
More
Credit Photo
If you would like to credit the Photo, here are some ways you can do so
Text Link
video Link
<span class="text-link">
<span>
<a target="_blank" href=https://pikwizard.com/video/global-financial-data-on-digital-world-map-display/35e40a240ec9084ba1efad47277df0be/>PikWizard</a>
</span>
</span>
<span class="image-link">
<span
style="margin: 0 0 20px 0; display: inline-block; vertical-align: middle; width: 100%;"
>
<a
target="_blank"
href="https://pikwizard.com/video/global-financial-data-on-digital-world-map-display/35e40a240ec9084ba1efad47277df0be/"
style="text-decoration: none; font-size: 10px; margin: 0;"
>
<video controls style="width: 100%; margin: 0;">
<source src="https://player.vimeo.com/external/443387151.sd.mp4?s=470f6a97f5d8673d50173e1bf95cc3d1895651fd&profile_id=139&oauth2_token_id=1223210874" type="video/mp4"
poster="https://pikwizard.com/pw/medium/35e40a240ec9084ba1efad47277df0be.jpg"/>
Your browser does not support the video tag.
</video>
<p style="font-size: 12px; margin: 0;">PikWizard</p>
</a>
</span>
</span>
Free (free of charge)
Free for personal and commercial use.
Author: Awesome Content