
- Home >
- Stock Videos >
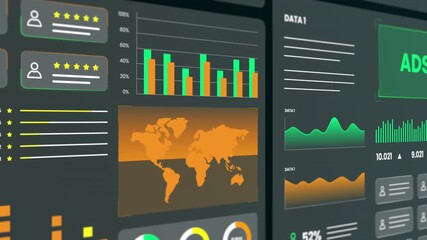
- Global Financial Data Processing Display with Dynamic Connections
Global Financial Data Processing Display with Dynamic Connections Video

Dynamic visual of financial data processing on a digital globe with interconnected points. Ideal for illustrating global finance concepts, data analytics, stock market information, technological investment strategies, and business technology presentations.
Powered by 


downloads
Tags:
More
Credit Photo
If you would like to credit the Photo, here are some ways you can do so
Text Link
video Link
<span class="text-link">
<span>
<a target="_blank" href=https://pikwizard.com/video/global-financial-data-processing-display-with-dynamic-connections/7d01c50d37f58c395bf305f7ddfdef1f/>PikWizard</a>
</span>
</span>
<span class="image-link">
<span
style="margin: 0 0 20px 0; display: inline-block; vertical-align: middle; width: 100%;"
>
<a
target="_blank"
href="https://pikwizard.com/video/global-financial-data-processing-display-with-dynamic-connections/7d01c50d37f58c395bf305f7ddfdef1f/"
style="text-decoration: none; font-size: 10px; margin: 0;"
>
<video controls style="width: 100%; margin: 0;">
<source src="https://player.vimeo.com/progressive_redirect/playback/809946921/rendition/240p/file.mp4?loc=external&oauth2_token_id=1223210874&signature=e2863a77bf52186179f39487cc3ddf708e101a52a94731cb18af99a4815742e7" type="video/mp4"
poster="https://pikwizard.com/pw/medium/7d01c50d37f58c395bf305f7ddfdef1f.jpg"/>
Your browser does not support the video tag.
</video>
<p style="font-size: 12px; margin: 0;">PikWizard</p>
</a>
</span>
</span>
Free (free of charge)
Free for personal and commercial use.
Author: Awesome Content