
- Home >
- Stock Videos >
- Global Financial Data Visualization on World Map
Global Financial Data Visualization on World Map Video
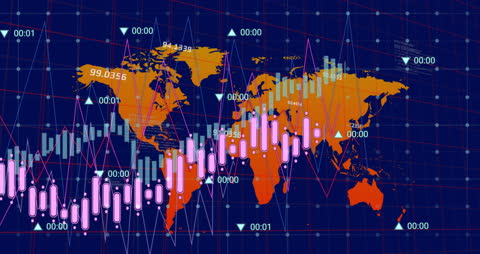
This animation features financial data trends overlaid on a world map background, offering a digital interface representation ideal for global business and finance contexts. Such designs are valuable in illustrating economic growth, stock market analysis, fintech innovations, and trading strategies for corporate presentations or financial technology applications.

downloads
Tags:
More
Credit Photo
If you would like to credit the Photo, here are some ways you can do so
Text Link
video Link
<span class="text-link">
<span>
<a target="_blank" href=https://pikwizard.com/video/global-financial-data-visualization-on-world-map/29a8a6e6d7d4496a3f10bb42c37f4c22/>PikWizard</a>
</span>
</span>
<span class="image-link">
<span
style="margin: 0 0 20px 0; display: inline-block; vertical-align: middle; width: 100%;"
>
<a
target="_blank"
href="https://pikwizard.com/video/global-financial-data-visualization-on-world-map/29a8a6e6d7d4496a3f10bb42c37f4c22/"
style="text-decoration: none; font-size: 10px; margin: 0;"
>
<video controls style="width: 100%; margin: 0;">
<source src="https://player.vimeo.com/progressive_redirect/playback/790441807/rendition/240p/file.mp4?loc=external&oauth2_token_id=1223210874&signature=bc3e6202936d67041995859abdef3362569ba403e89d63b97e2ff9e65eb376b0" type="video/mp4"
poster="https://pikwizard.com/pw/medium/29a8a6e6d7d4496a3f10bb42c37f4c22.jpg"/>
Your browser does not support the video tag.
</video>
<p style="font-size: 12px; margin: 0;">PikWizard</p>
</a>
</span>
</span>
Free (free of charge)
Free for personal and commercial use.
Author: Awesome Content